Slight Change to Triad

My apologies to who sent me a note a while back and asked why I didn't use BIL / Cash returns as one of the Risk Off options for the Triad strategies. Ironically this is one of the changes that I made from GPM to GPMv is adding BIL as a Risk Off option, but inexplicably left it out of Triad. It doesn't make a large difference including or excluding BIL, but it does lower the Ulcer Index a little bit and ultimately a worthy inclusion especially as it is more adaptable to higher rate periods.

Sorry that I don't remember who asked me about this, would like to give credit where credit is due, thank you.

GPMv Review 2 years history

GPMv is a strategy that was not home grown at Dual Momentum Systems, it started off as a well known strategy by Keuning & Keller. I wrote about how I came back to GPM with interest, and had some thoughts up how to better suit it for me, this writeup talks about that process, worthy of a first read or a refresher. Article: GPMv is Born

It has now been two years since the birth of GPMv which seems like a good time to check in on it and see how it is doing compared to the original GPM strategy.

Both GPM and GPMv have underperformed relative to their 1980 to current, or 2000 to current performance, just to get that out of the way, the real question is how did the GPM Variant perform to the original in the 24 months after it was developed.

Pretty darn well!


Not only has GPMv returned 9.15% more gains than GPM over the past two years, but it managed to do it with 10% lower Maximum Drawdown than GPM did also. Certainly this outperformance to GPM shouldn't be expected to persist, however, it does illustrate that so far the changes which made GPMv different from GPM have indeed played out rather well so far.

Compared to a 60/40 portfolio over the past two years, GPM underperformed the 60/40 benchmark by 6.20%, and GPMv outperformed the 60/40 benchmark by 2.95%.

Stacks Image 1059
Stacks Image 1089
Stacks Image 1091
Stacks Image 1093

Changing "Retire" to Conservative

There are three Model Portfolios:
  • Model Retire Portfolio
  • Model Moderate Portfolio
  • Moderate Aggressive Portfolio

These are stellar couplings of strategies to achieve investing goals. The "Retire" is being retired in favor of the term 'conservative' which is really a better description of the portfolio.

A Closer look at DMS Model Portfolios

Model Retire Portfolio

(You can look at the latest Reporting Decks for the DMS Strategies, and DMS Bamboo Portfolios for more detail.)

Let's dig into the returns and metrics of the strategies that make up some Model Portfolios here at DMS and see how it plays out. From Jan 2000 through Mar 2024 the three strategies that are a part of the Model Retire Portfolio provided similar compounded annual growth rate, CAGR:

Bamboo+ Portfolio 9.11%, Triad 11.70%, GPMv 9.95%

If we look at some key metrics over the same time period we can see how these three strategies compare to each other.

Maximum Drawdown
(the closer to 0 the better)
Bamboo+ Portfolio -16.44%, Triad -11.33%, GPMv -10.75%

Ulcer Index
(the lower the better)
Bamboo+ Portfolio 3.82, Triad 2.58, GPMv 3.02

Ulcer Performance Index
(the higher the number the better)
Bamboo+ Portfolio 2.27, Triad 3.82, GPMv 3.15

Gain to Pain
(the higher the number the better)
Bamboo+ Portfolio 1.13, Triad 1.63, GPMv 1.63

These metrics show that all three strategies had far less maximum drawdown than the -32.33% that a 60/40 portfolio experienced, and miles better than the -50.79% that the S&P 500 suffered. GPMv had the lowest drawdown, followed closely by Triad, Bamboo+ was not at all bad with a drawdown of -16.44%, and it is not surprisingly a little higher since this is an allocation strategy which is positioned for holding all the time, and it does not go risk off.

All three strategies have very respectable Ulcer Index's, especially when you consider than the highly guarded and staple portfolio of 60% stocks and 40% bonds has an Ulcer Index of 7.93, and the S&P 500 16.37!

The Ulcer Performance Index, UPI, is highest with Triad, this is a factor of it's best return over the time period, combined it's very low Ulcer Index. The other two strategies have lower UPI, but far better than the 60/40 and S&P 500 which are 0.73 and 0.42.

For this time period, Triad is the winner (GPMv is the winner if we look at 1980 forward). That isn't really the focus of this post though, I want to show how the Model Retire Portfolio which consists of 1/3rd of each of these strategies compares to the individual strategies.

Simple math tells us that the average return of the three strategies is 10.25%, and the Model Retire Portfolio clocks in very close at 9.91%. 

The maximum drawdown of the three strategies was -16.44%, -11.33%, and -10.75%, but the maximum drawdown of the Model Retire Portfolio is just -6.54%! The three strategies move differently from one another, and instead of amplifying drawdowns, they are uncorrelated in their movement and end up canceling out some of the larger drawdowns. We can also see this in the Ulcer Index. the three strategies had Ulcer Index of 3.82, 2.58, and 3.02, but the Model Retire Portfolio has an  Ulcer Index of just 2.08, the Model Retire Portfolio is significantly less volatile than any of the three strategies which make up this portfolio. As a result of the very low Ulcer Index the UPI soars at 4.54, far higher than the 2.27, 3.82, and 3.15 of the three strategies in the Portfolio.

Gain to Pain for the three strategies are 1.13, 1.63, and 1.63, and the Model Retire Portfolio has a Gain to Pain of 1.77, another nice improvement.


Let this sink in, over a period greater than 24 years the Model Retire Portfolio generates a return which is far higher than the S&P or a 60/40 and never sustained even a 7% drawdown along the way.

Stacks Image 1023


Model Moderate Portfolio

Let's take a quick look at the Model Moderate Portfolio and see if this improvement persists across strategies. The Model Moderate Portfolio consists of 25% GPMv, 25% Bamboo ++ Portfolio, and 50% Global Navigator+ 16.12%. The Model Moderate Portfolio CAGR comes in at 13.62%.

Ulcer Index for the three strategies is: 3.02, 4.29, and 5.39, the Model Moderate Portfolio has an Ulcer Index of 3.37, far better than the weighted average of the three strategies of 4.53.

The individual UPI's are 3.15, 2.53, 2.91 while the Model Moderate Portfolio has a superior UPI of 3.91.

The individual Gain to Pain are 1.63, 1.23, 1.64 while the Model Moderate Portfolio has a superior UPI of 1.91.

The individual Maximum Drawdowns are -10.75%, -16.44%, -18.23% while the Model Moderate Portfolio has a better MaxDD of -12.14%. Only GPMv had a lower drawdown, but the returns are significantly higher for the Model Moderate Portfolio than GPMv. 

Once again we saw far better overall metrics, returns vs the associated risks, by combining three of the strategies than the strategies performed in a silo.


Stacks Image 1027


Model Aggressive Portfolio

One more, let's look at the Model Aggressive Portfolio which consists of 15% Triad++, 10% Global Navigator+, 60% LT Gain++, and 15% DBMF.

Metrics for the four components and the Model Aggressive Portfolio:

Maximum Drawdowns: -13.94%, -18.23%, -31.24%, -17.35%; MAP: -19.07%, far better considering 60% of the portfolio experienced over a 30% drawdown.

Ulcer Index: 3.75, 5.39, 6.92, 6.31; MAP: 4.68, tremendous improvement.

Ulcer Performance Index: 3.42, 2.91, 3.28, 0.73; MAP: 3.94, again a tremendous improvement.

Gain to Pain: 1.55, 1.64, 1.54, 0.53; MAP: 1.64, another improvement, not as significant this time with the Gain to Pain, but still an improvement.

Portfolio Construction

When putting together a Model Portfolio, I primarily look at the CAGR, and the average and maximum leverage. I try to make sure that the average and maximum leverage are suitable in my opinion for Retire, Moderate, and Aggressive, of course somebody else's viewpoint could be very different and the portfolios may need tweaking to meet their tolerances. You may have different criteria, but you can certainly improve the risk adjusted returns by combining different strategies, and setting targets for leverage which you are comfortable with.


Stacks Image 1031


Which Model Portfolio suites your investing temperament? Or do none of them fit?

Let me know!

randy@dualmomentumsystems.com

DMS-4ETF becomes Bamboo Portfolios

DMS-4ETF, why did I keep it so long?

The allocation portfolio name took on a moniker of "4ETF" for the simple reason, it used 4 ETF's. I knew that I would name the allocation, but it just never came. I have to wonder if deep down I wasn't happy with the allocation which is why a name never materialized.

Below I go into some detail on how and why I just recently tweaked the allocations for the better, and in the process a name came to me. From know on, the newly tweaked DMS-4ETF allocation strategies will be known as the Bamboo Portfolios.
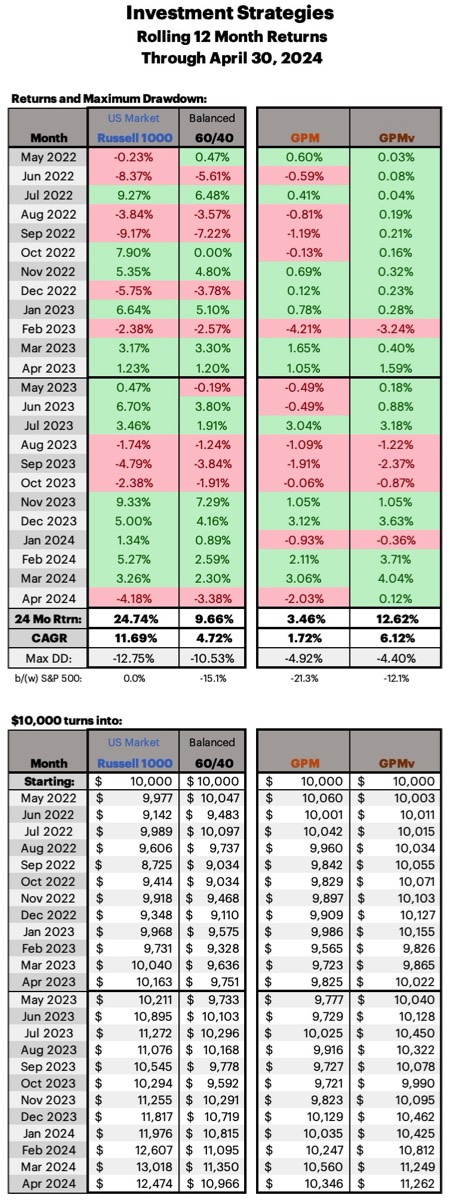


DMS-4ETF and it’s original goal:

When I came up with the allocation strategy for the DMS-4ETF funds, my thought was something better than a 60/40 with once a year re-balancing, make Smart Leverage for outperformance an optional version. When it came together, I was very happy that it panned out, the returns were better than 60/40 with similar drawdown. I was happy with the results and put it into production.
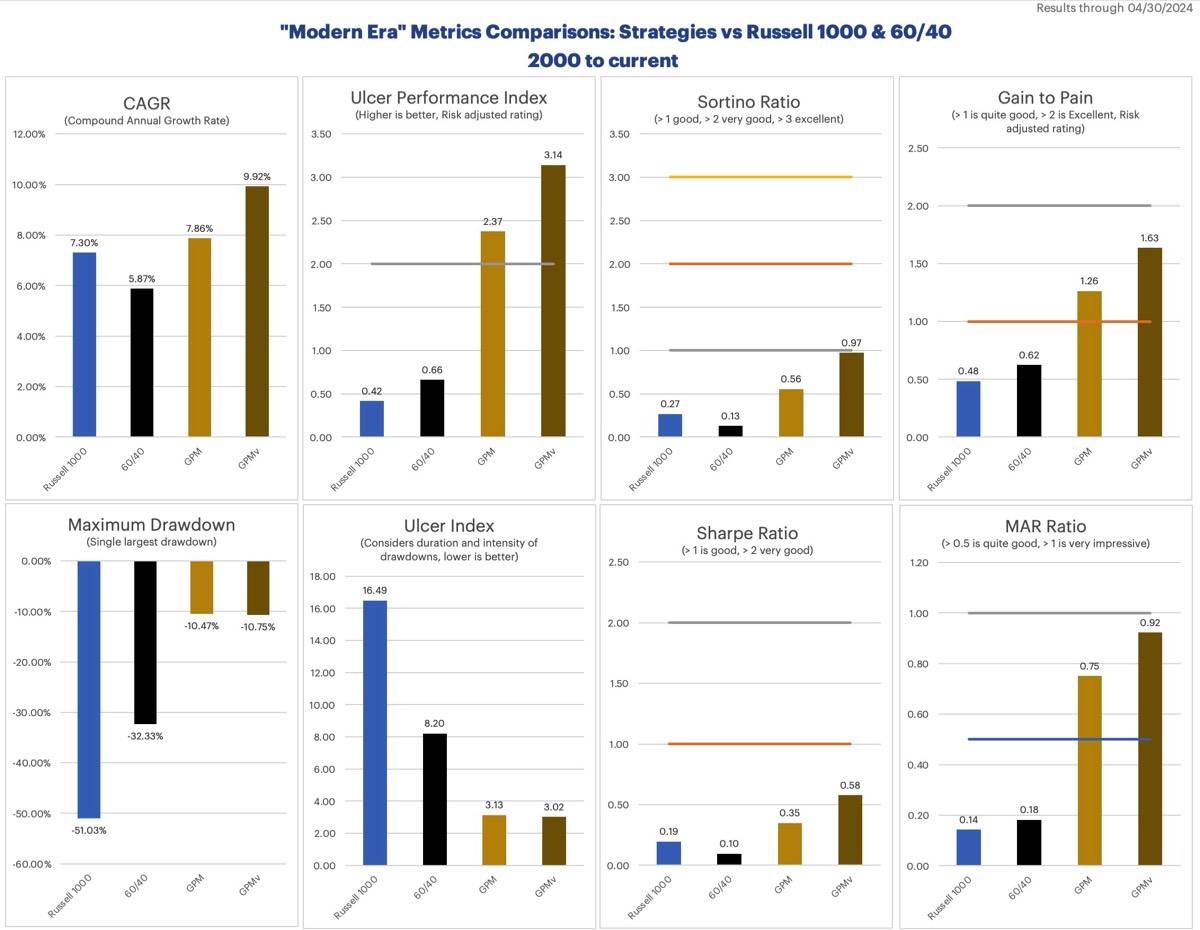

Why did DMS-4ETF just change?

The other day I working on putting together comparative data from some very popular allocation strategies like 60/40 which is pretty much the benchmark allocation, Permanent Portfolio by Harry Dent, All Season / All Weather by Ray Dalio, and Golden Butterfly by “Tyler" of 
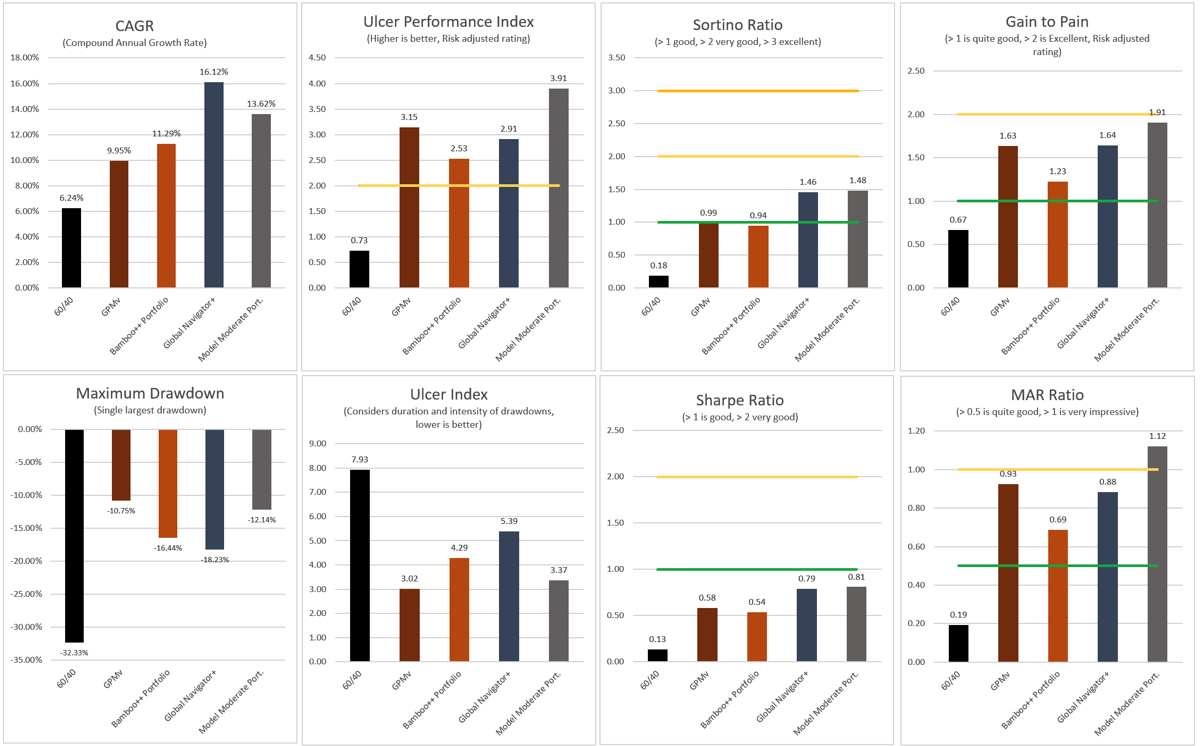
PortfolioCharts. [I would have liked to go back further, but my allocation uses Managed Futures and I couldn’t get return data back to 1980] After compiling all the data from 2000 forward I was really impressed, again, with Golden Butterfly. I say again because I had looked at Golden Butterfly in the past but forgot how very good an allocation it is, even compared to the allocations from industry heavyweights. Tyler goes for allocation strategies with only annual rebalancing, I primarily go towards tactical strategies which have possible investment changes each month, to me the extra movement is worth the outsized gains. However, I totally understand that many people would just rather allocate and leave it to be re-balanced in a year, and I had the desire to come up with an allocation strategy that could take advantage by using Smart Leverage. I also like to use a portfolio like this to pair with the Dual Momentum strategies, they complement each other nicely - in fact I may update my Model Portfolios to include the Bamboo Portfolios in the Model Portfolios.

As I was looking at the results of the mentioned strategies, I realized that I wasn’t happy with the weighting to stocks and the drawdowns that are similar to a 60/40; I knew that I really did prefer the far lower drawdowns of Golden Butterfly. I thought about it for a bit and make three changes to the DMS-4ETF allocation, primarily focused on lowering the equity allocation which lowers the drawdowns.

  1. The Russell 1000 allocation from reduced 55% to 40%.
  2. The US Hedged International Equities were swapped out for Aggregate Bonds
  3. The allocation to the non equity allocations of Gold, Managed Futures, and Aggregate Bonds were increased from 15% to 20% each.


Bamboo Portfolios

What was DMS-4ETF becomes the Bamboo Portfolios, with the changes mentioned, I felt the need to name the allocation strategies, so we now remove the placeholder DMS-4ETF and welcome the Bamboo Portfolios into the family.

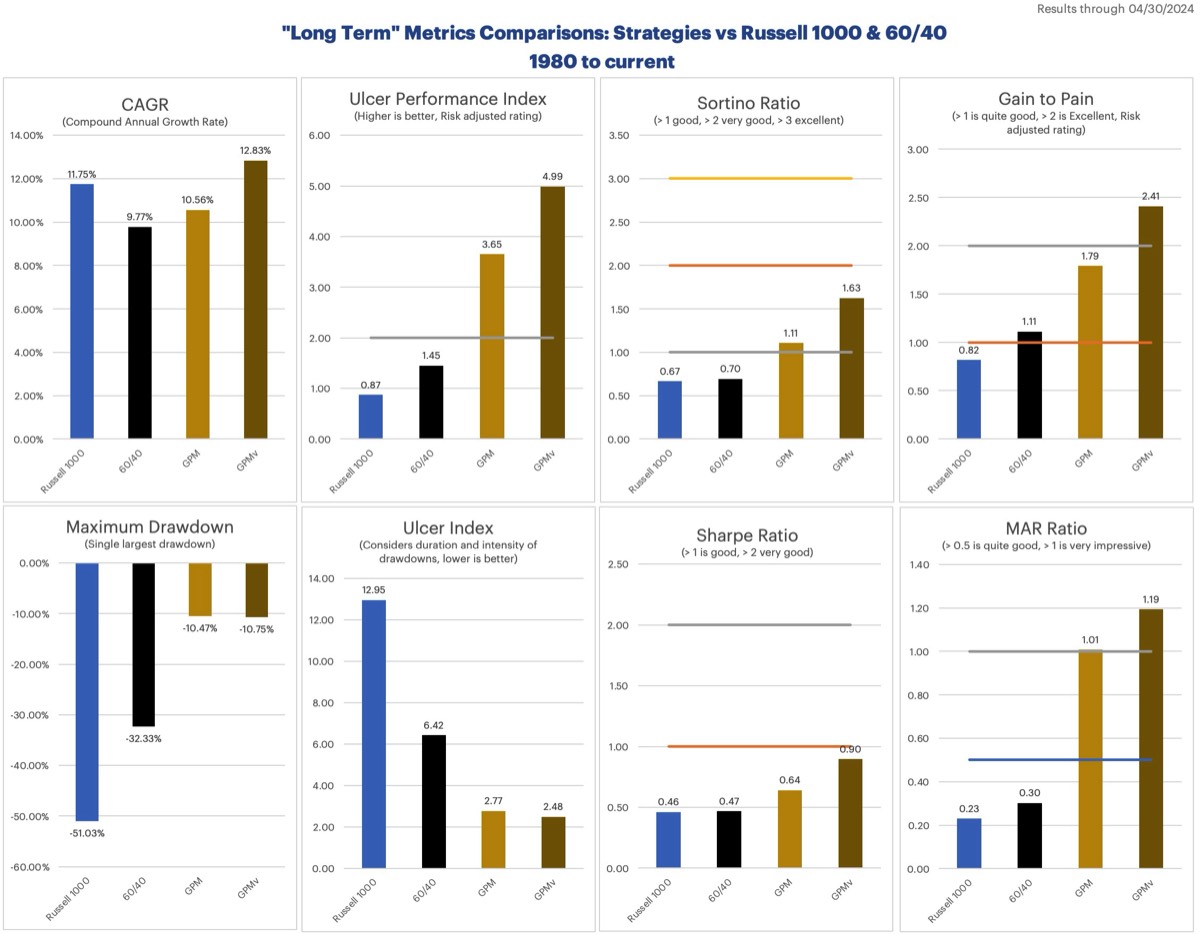
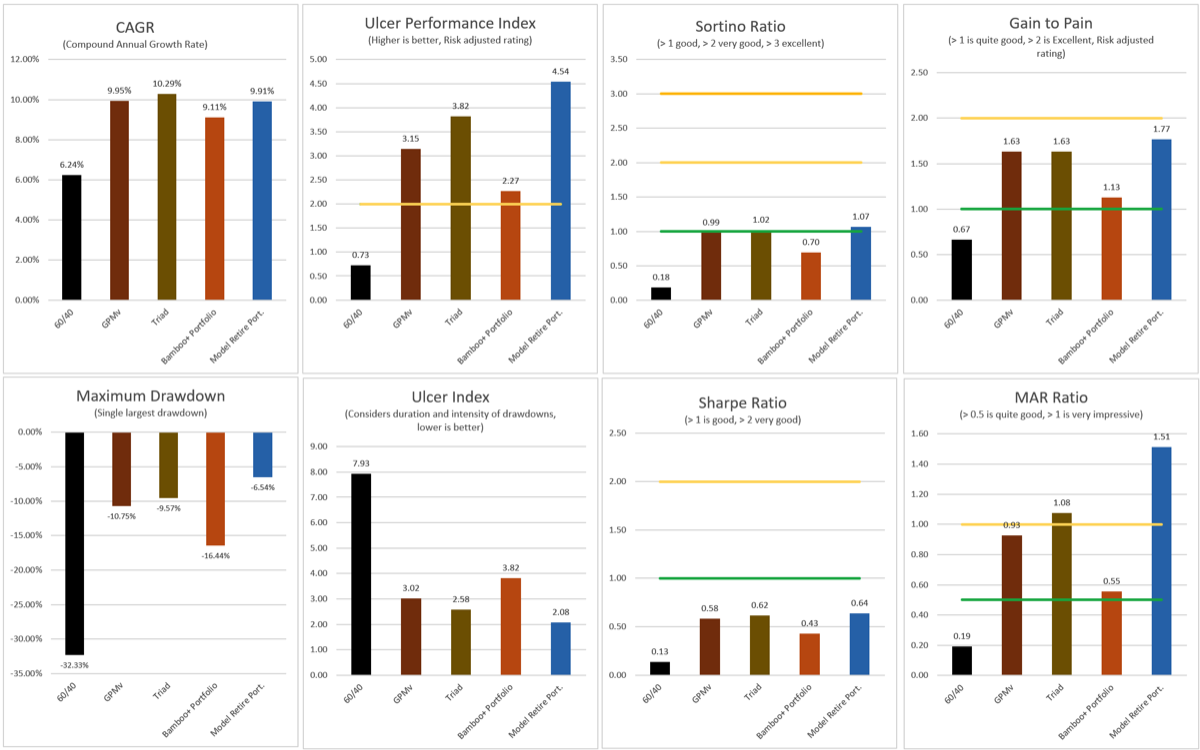
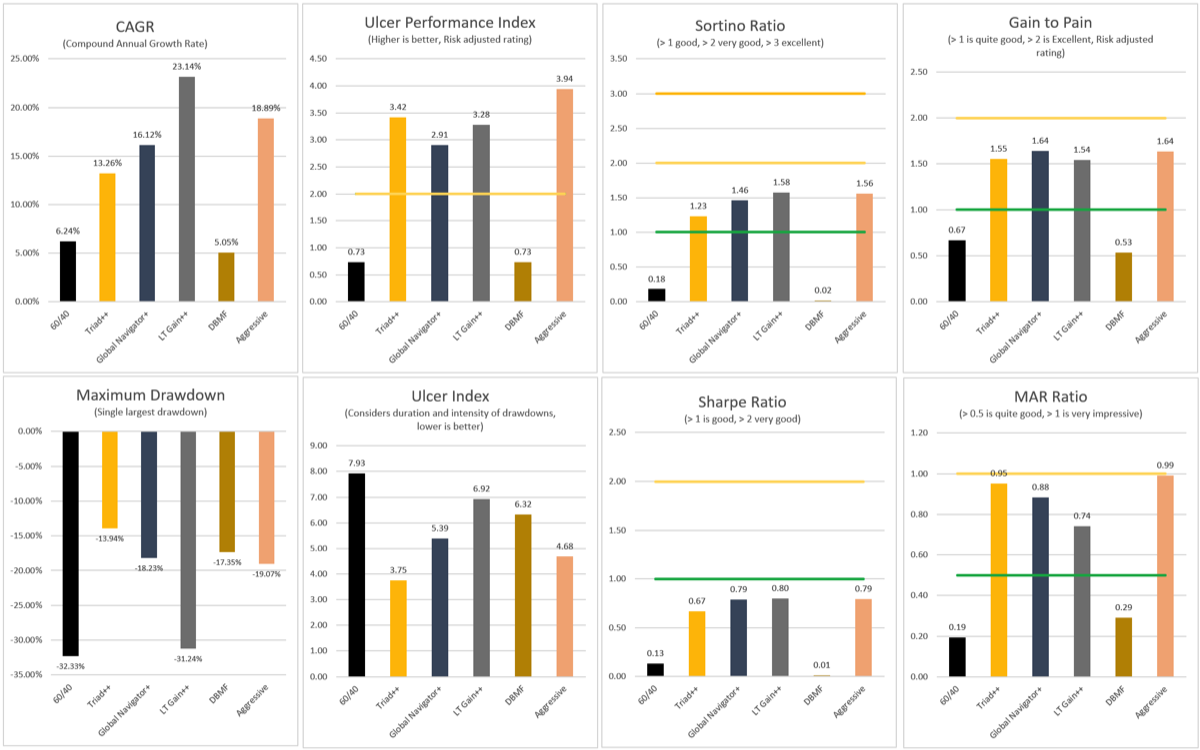
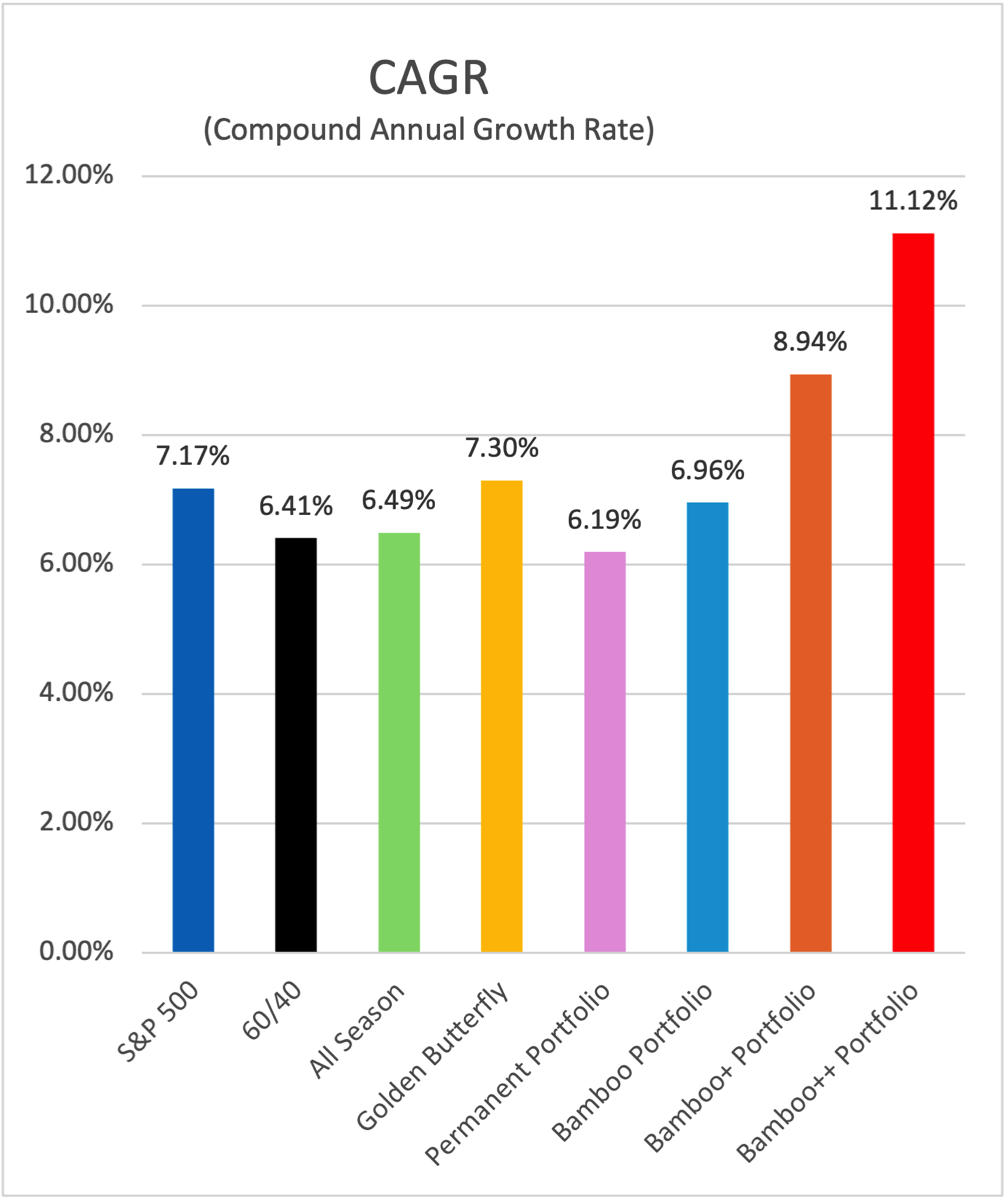
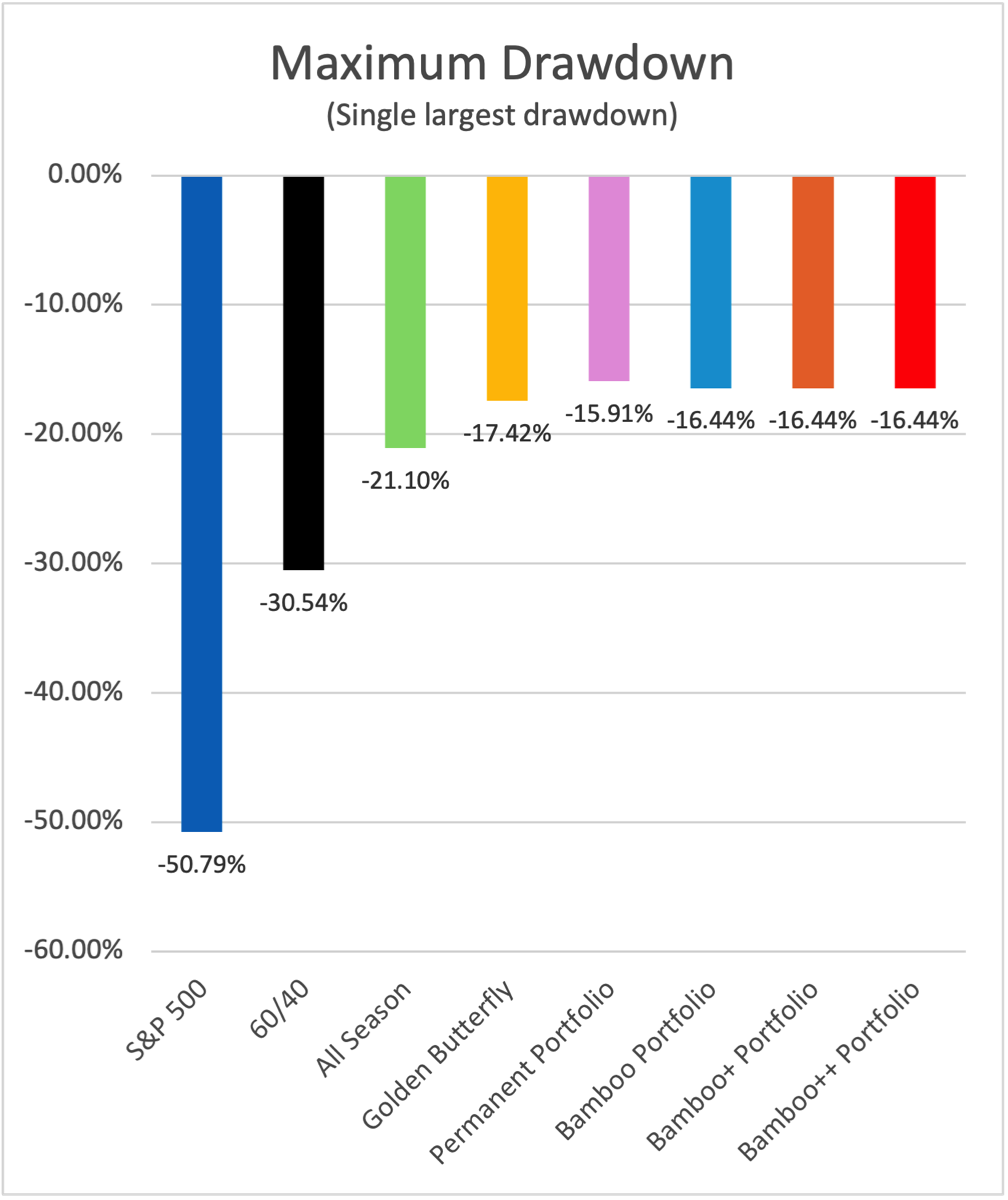
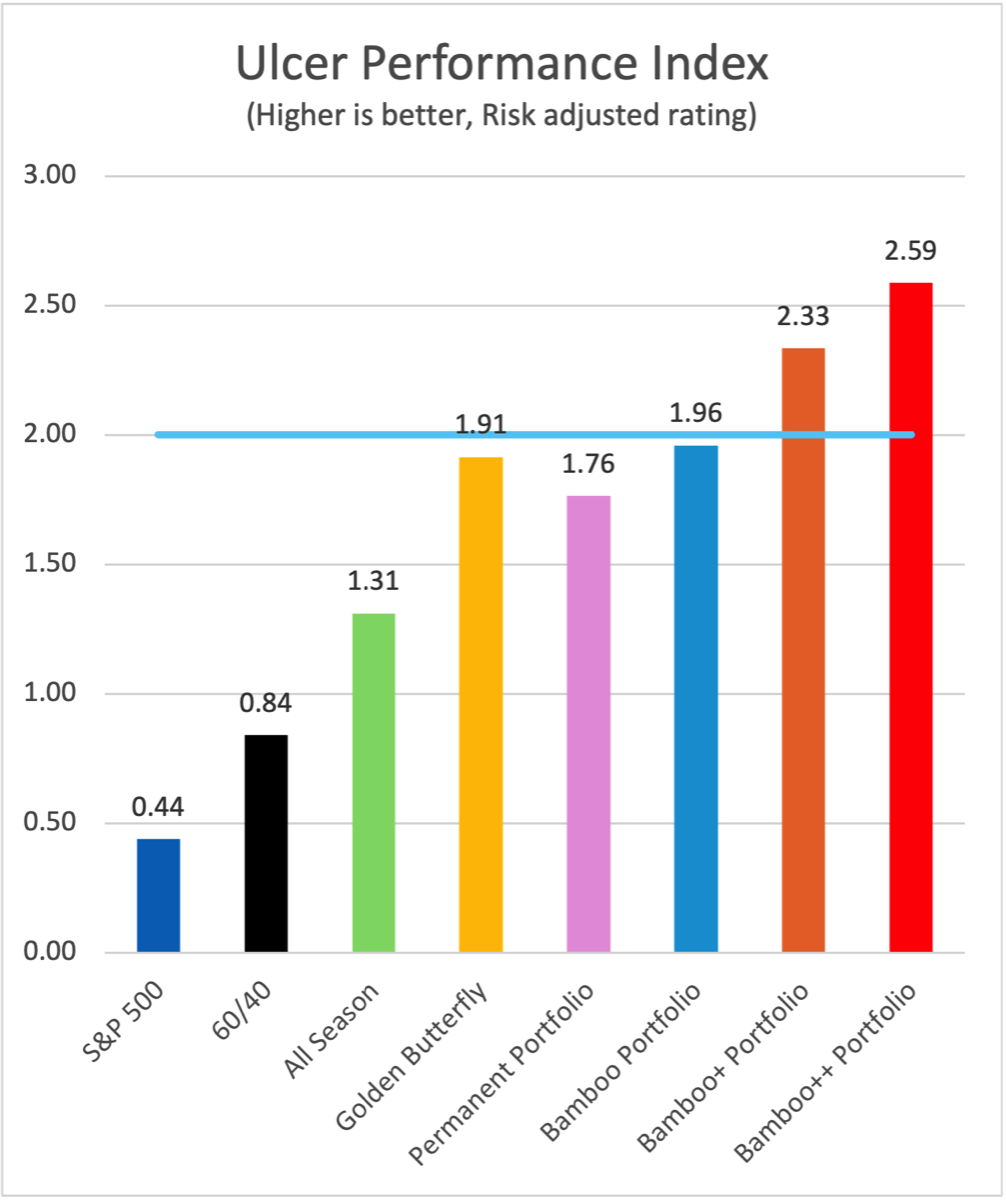
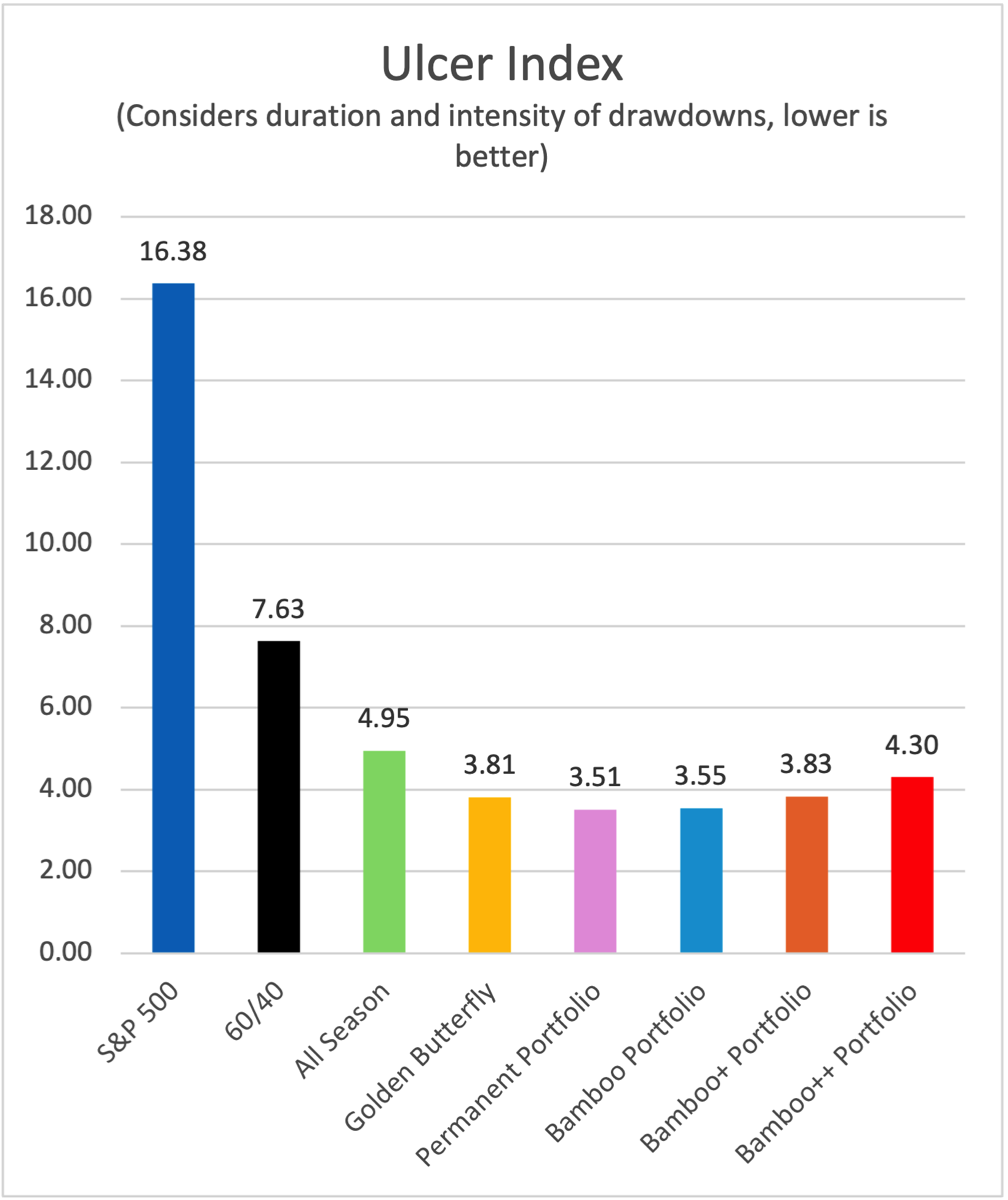
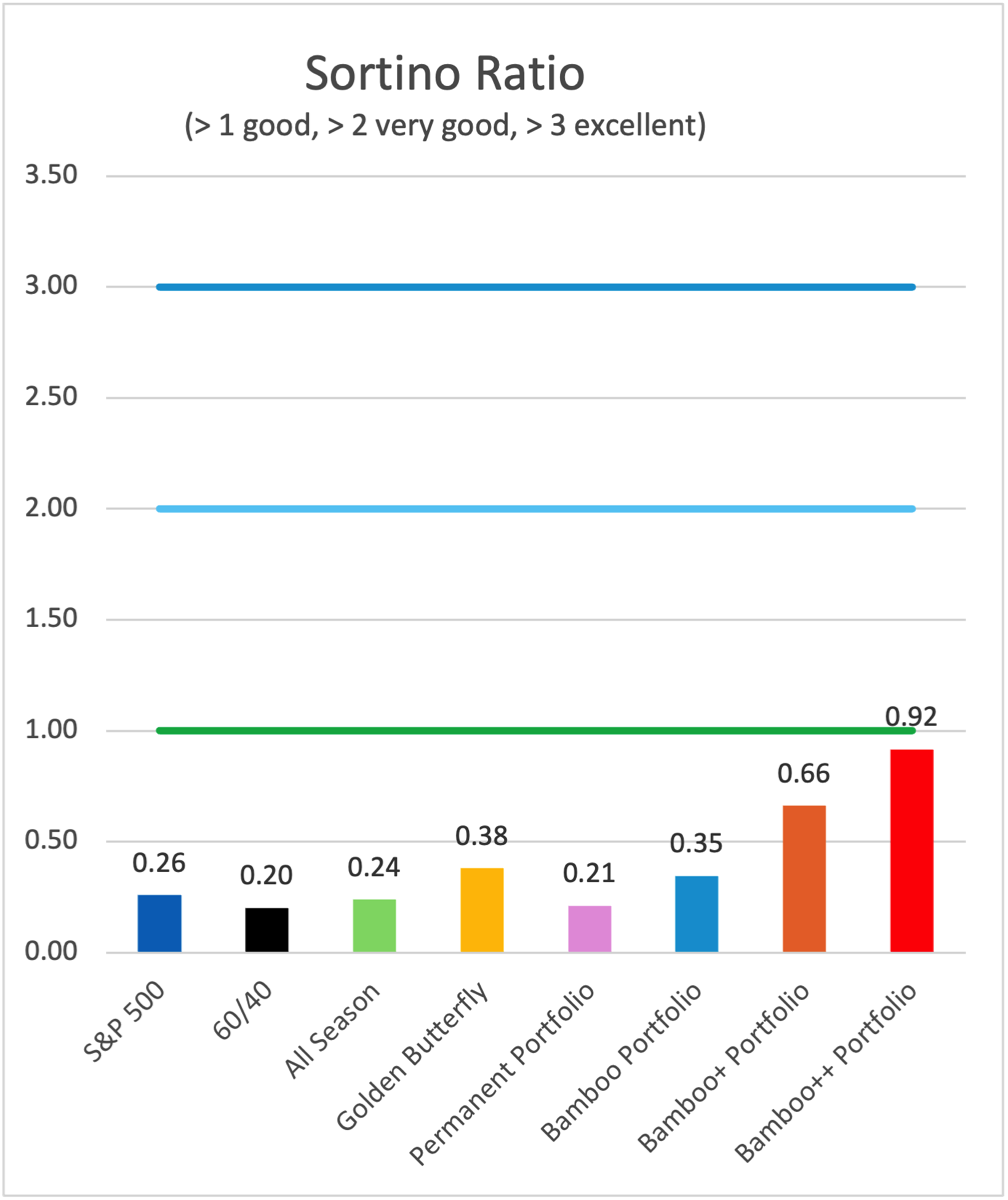
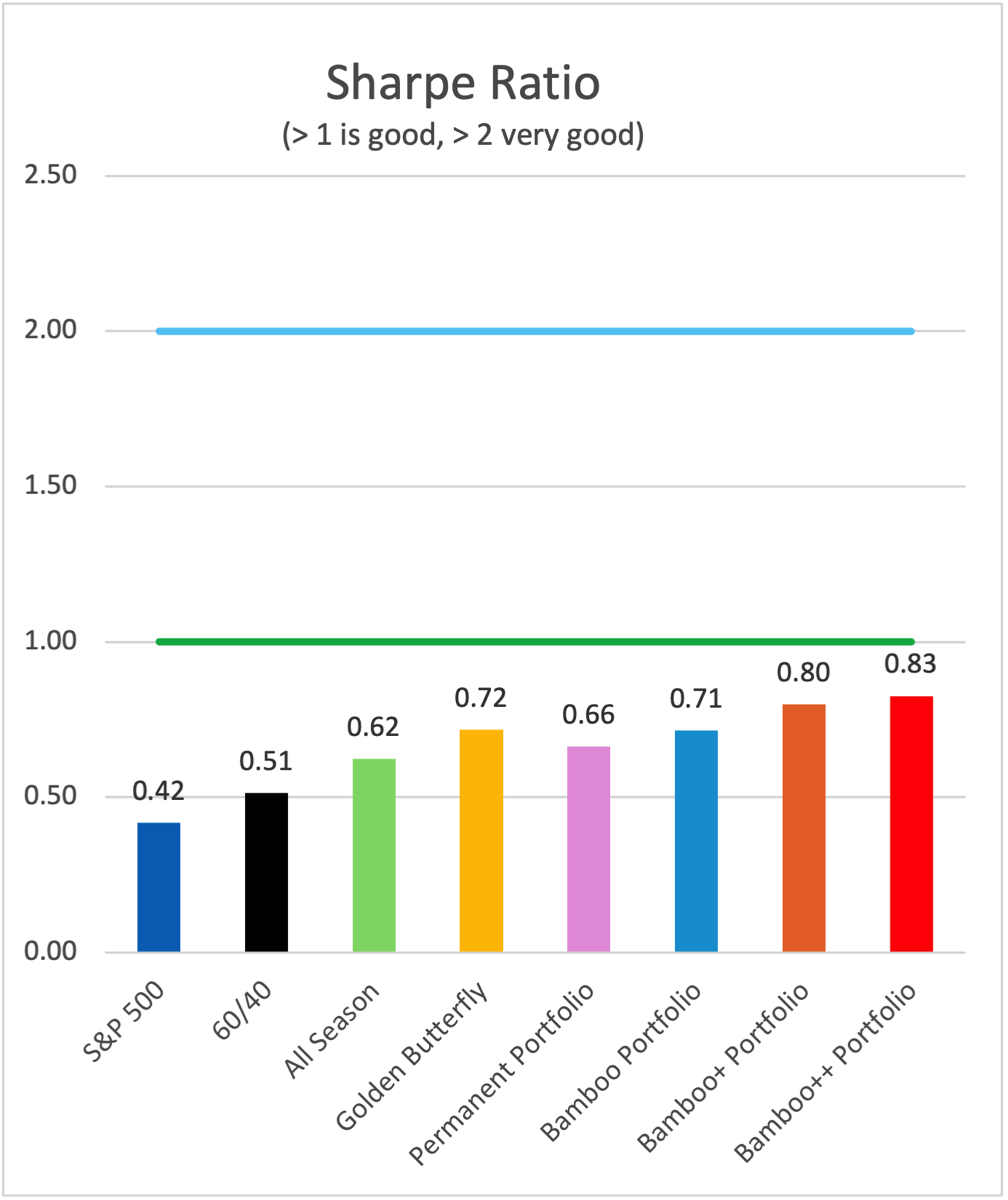
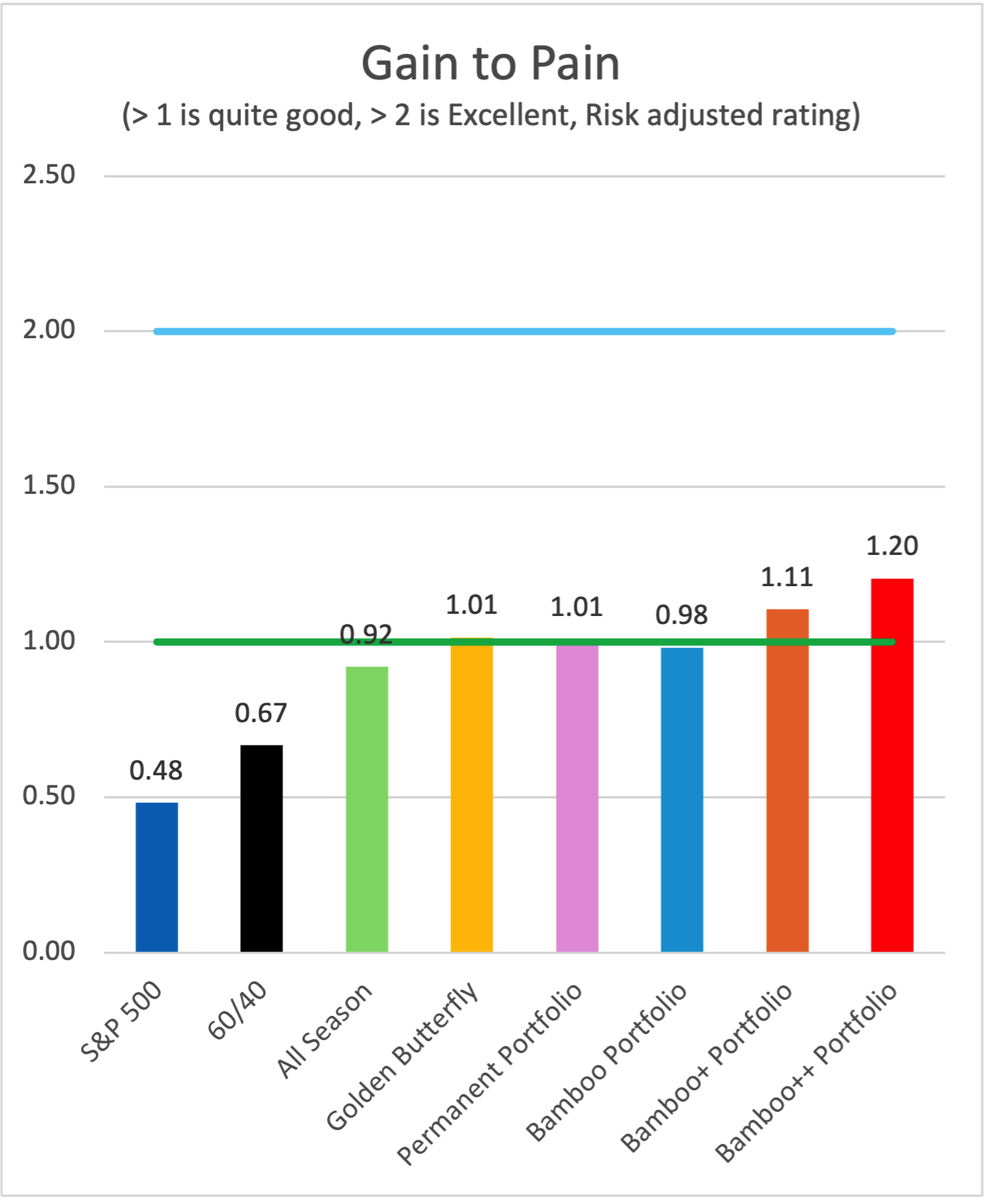
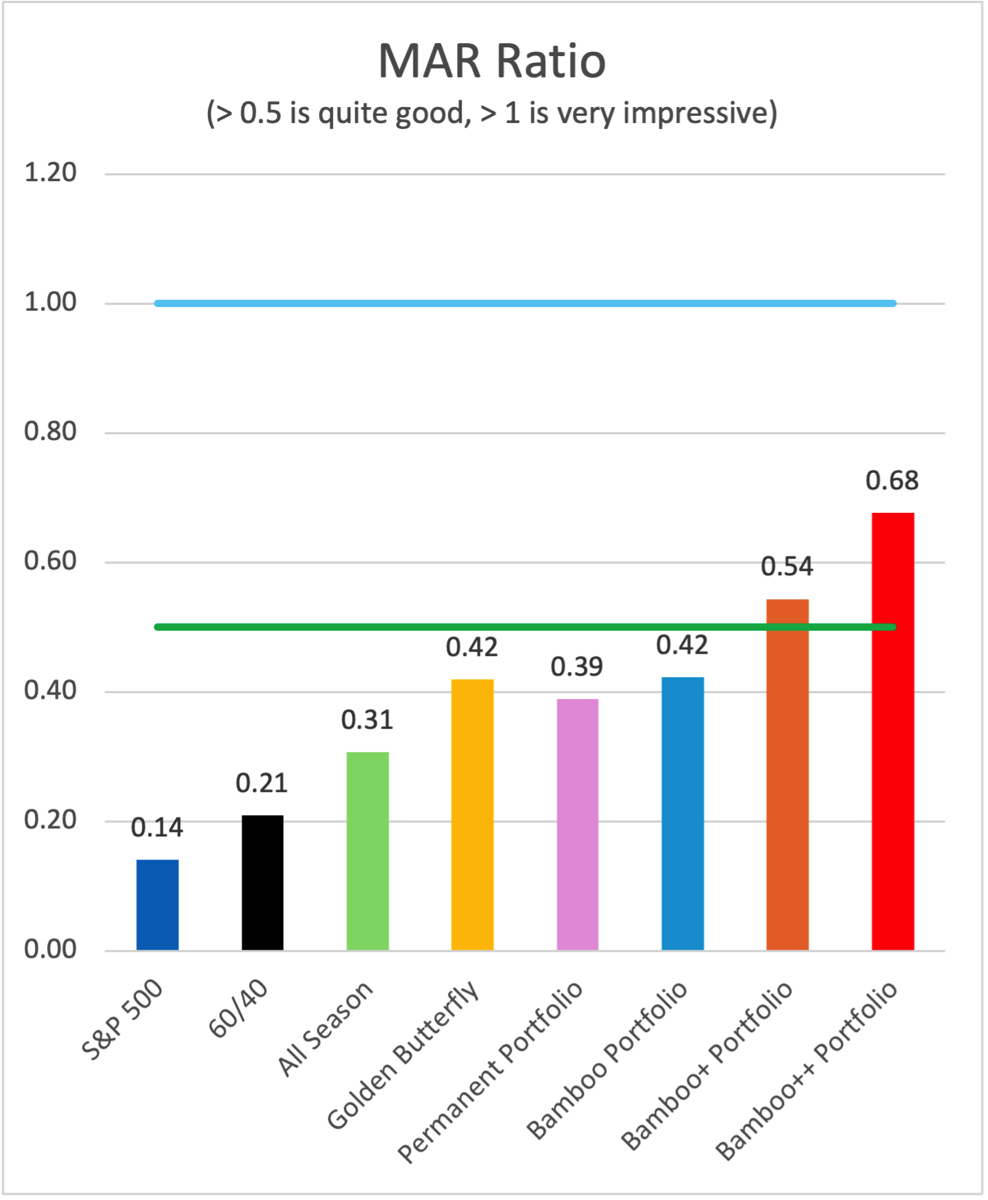
I could not be happier with the results, yes the returns came down a little, but the drawdowns dropped in half, and all the metrics improved tremendously. Mission accomplished. Great returns with far less volatility, and better upside with the versions using Smart Leverage. The allocation is literally world class. The performance metrics are terrific and only improve with the “+” Smart Leverage version, and even more so with the “++” version.


What is Smart Leverage?

Smart Leverage is a method to put the US Large Cap portion which is normally unleveraged into a leveraged position. This is triggered with month end to month end drawdown exceeds or equals 15%. This can be over many months, not just one month to the next, drawdowns accumulate over time in a net down market. The allocation will stay in the leveraged position for 1 year maximum, if the dual momentum perspective says to exit the position, then the leveraged Bamboo Portfolios will go back to an unleveraged position. Smart Leverage is a dual momentum metric used in many of the strategies.

Bamboo+ Portfolio will go into 2X [SSO] instead of IWB when Smart Leverage is a go, and Bamboo++ Portfolio will go into 3X [UPRO] instead of IWB when Smart Leverage is a go.
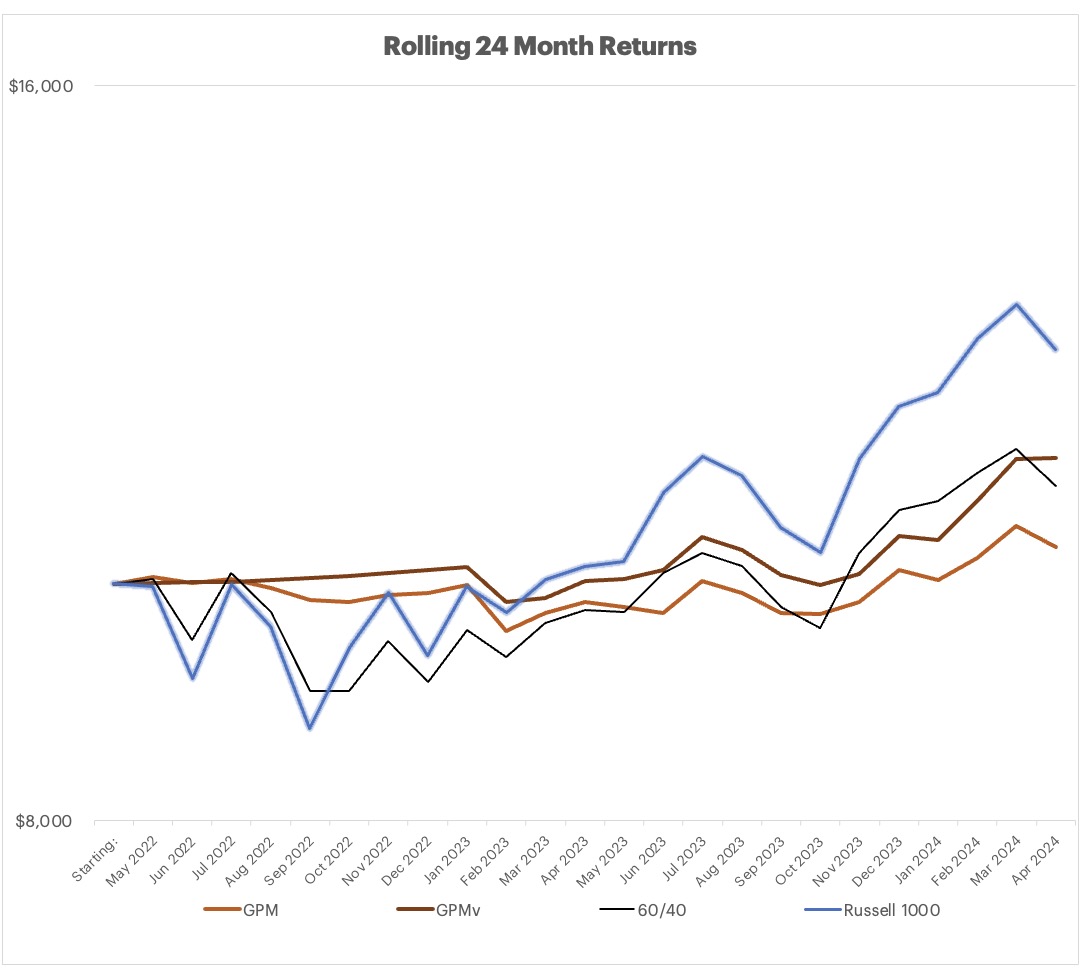
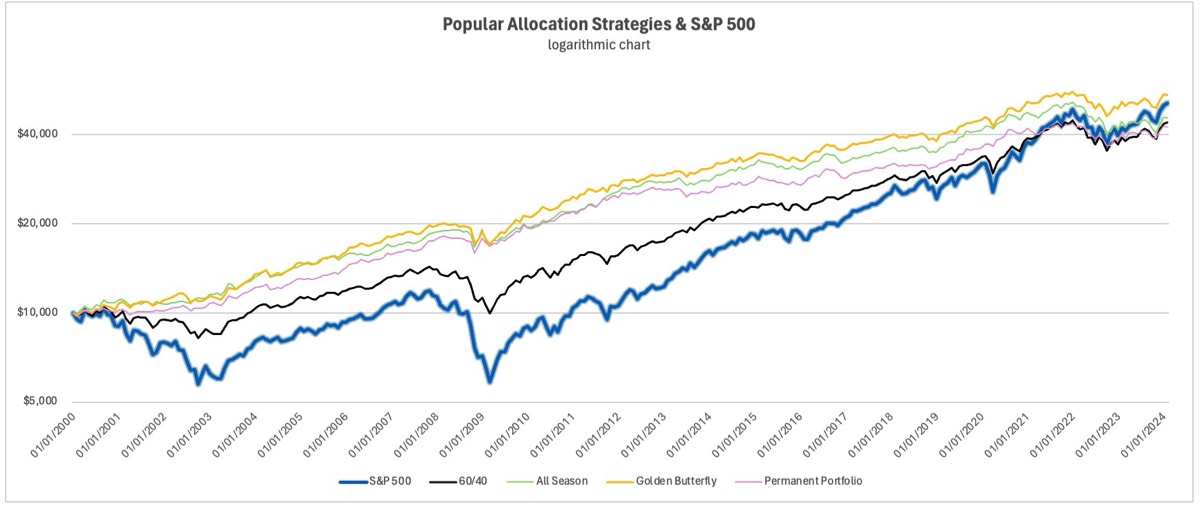
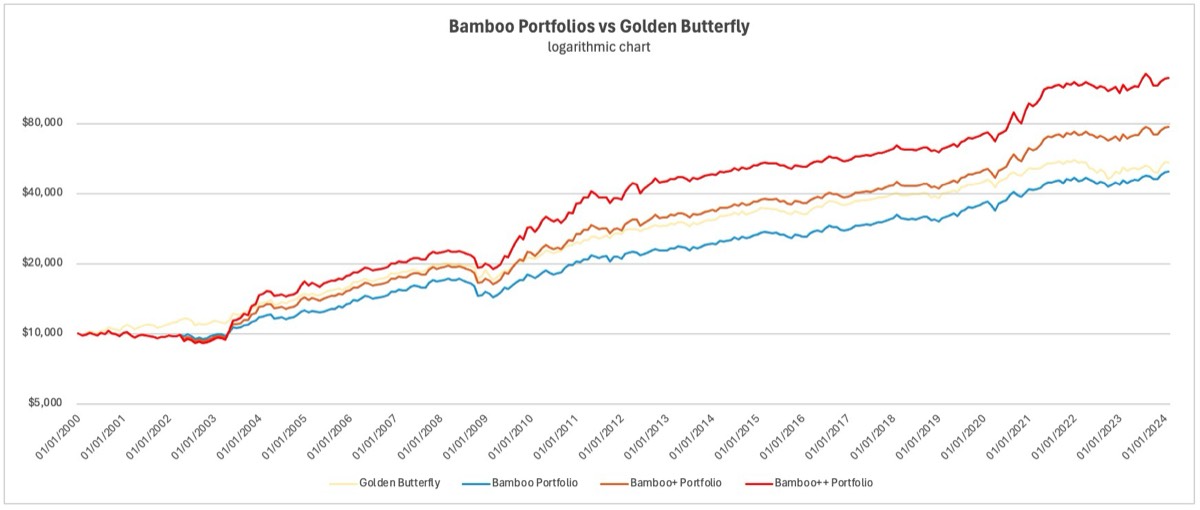

Comparative Data

Here are the Equity Charts for the comparative allocations, and then the Bamboo Portfolio allocations against Golden Butterfly. You can see that over this time period, which started off with the Dot Bomb, and also includes the Global Financial Crisis, the S&P 500 in particular, and the 60/40 saw major drawdowns. Golden Butterfly was tops most of this entire period and returned the highest equity from 2000 to now.
Stacks Image 985
Here is a chart showing Golden Butterfly and the three Bamboo Portfolio strategies. The ‘never any leverage’ Bamboo Portfolio underperforms the Golden Butterfly by a margin in the middle years of this chart, and nearly catches up by the end time period. You can see that the “+” and “++” versions obliterate Golden Butterfly over the entire time period, with similar drawdowns. One must also keep in mind that the past 20+ years have been very favorable to the performance of the 60/40 portfolio (and to some degree to Golden Butterfly with a 20% long treasury allocation), the fact that Bamboo Portfolio underperforms for a period of time is of no surprise to me, I am actually surprised it ends up being so close to Golden Butterfly at the end of the period.
Stacks Image 983

Metrics
Stacks Image 993
Stacks Image 1001
Stacks Image 1005
Stacks Image 1003
Stacks Image 999
Stacks Image 997
Stacks Image 995
Stacks Image 1007

Bamboo Portfolios and Golden Butterfly makeup

Bamboo Portfolios
  • US Large Cap, Russell 1000, IWB, 20%
  • Managed Futures, DBMF, 20% (you can use PQTIX for further history (SG CTA Index for further back)
  • Aggregate US Bonds, BND, 20%
  • Gold, SGOL, 20%

Bamboo+ will go into SSO instead of IWB for a period of time, and Bamboo++ into UPRO for a period of time.


Golden Butterfly
  • Total US Market, VTI, 20%
  • Small Cap Value, VBR, 20%
  • Short Term Treasuries, VGSH, 20%
  • Long Term Treasuries, TLT, 20%
  • Gold, SGOL, 20%


Here are links to Portfolio Visualizer, Bamboo Portfolio and Golden Butterfly, and here is a longer term one using PQTIX instead of DBMF.

Wrap up

If I had to choose, I'd pick the dual momentum based strategies over annually rebalanced allocation strategies. But not everybody would, and they both complement each other well. Welcome to the Bamboo Portfolios, may they enhance your investing.

Subscribe (free) to the monthly reports which will alert you to any Smart Leverage positions for Bamboo+ or Bamboo++.

Thank you.

February Reporting Deck for the Bamboo Portfolios.
Page 1 / 8 Next Page >