The perfect portfolio allocation is
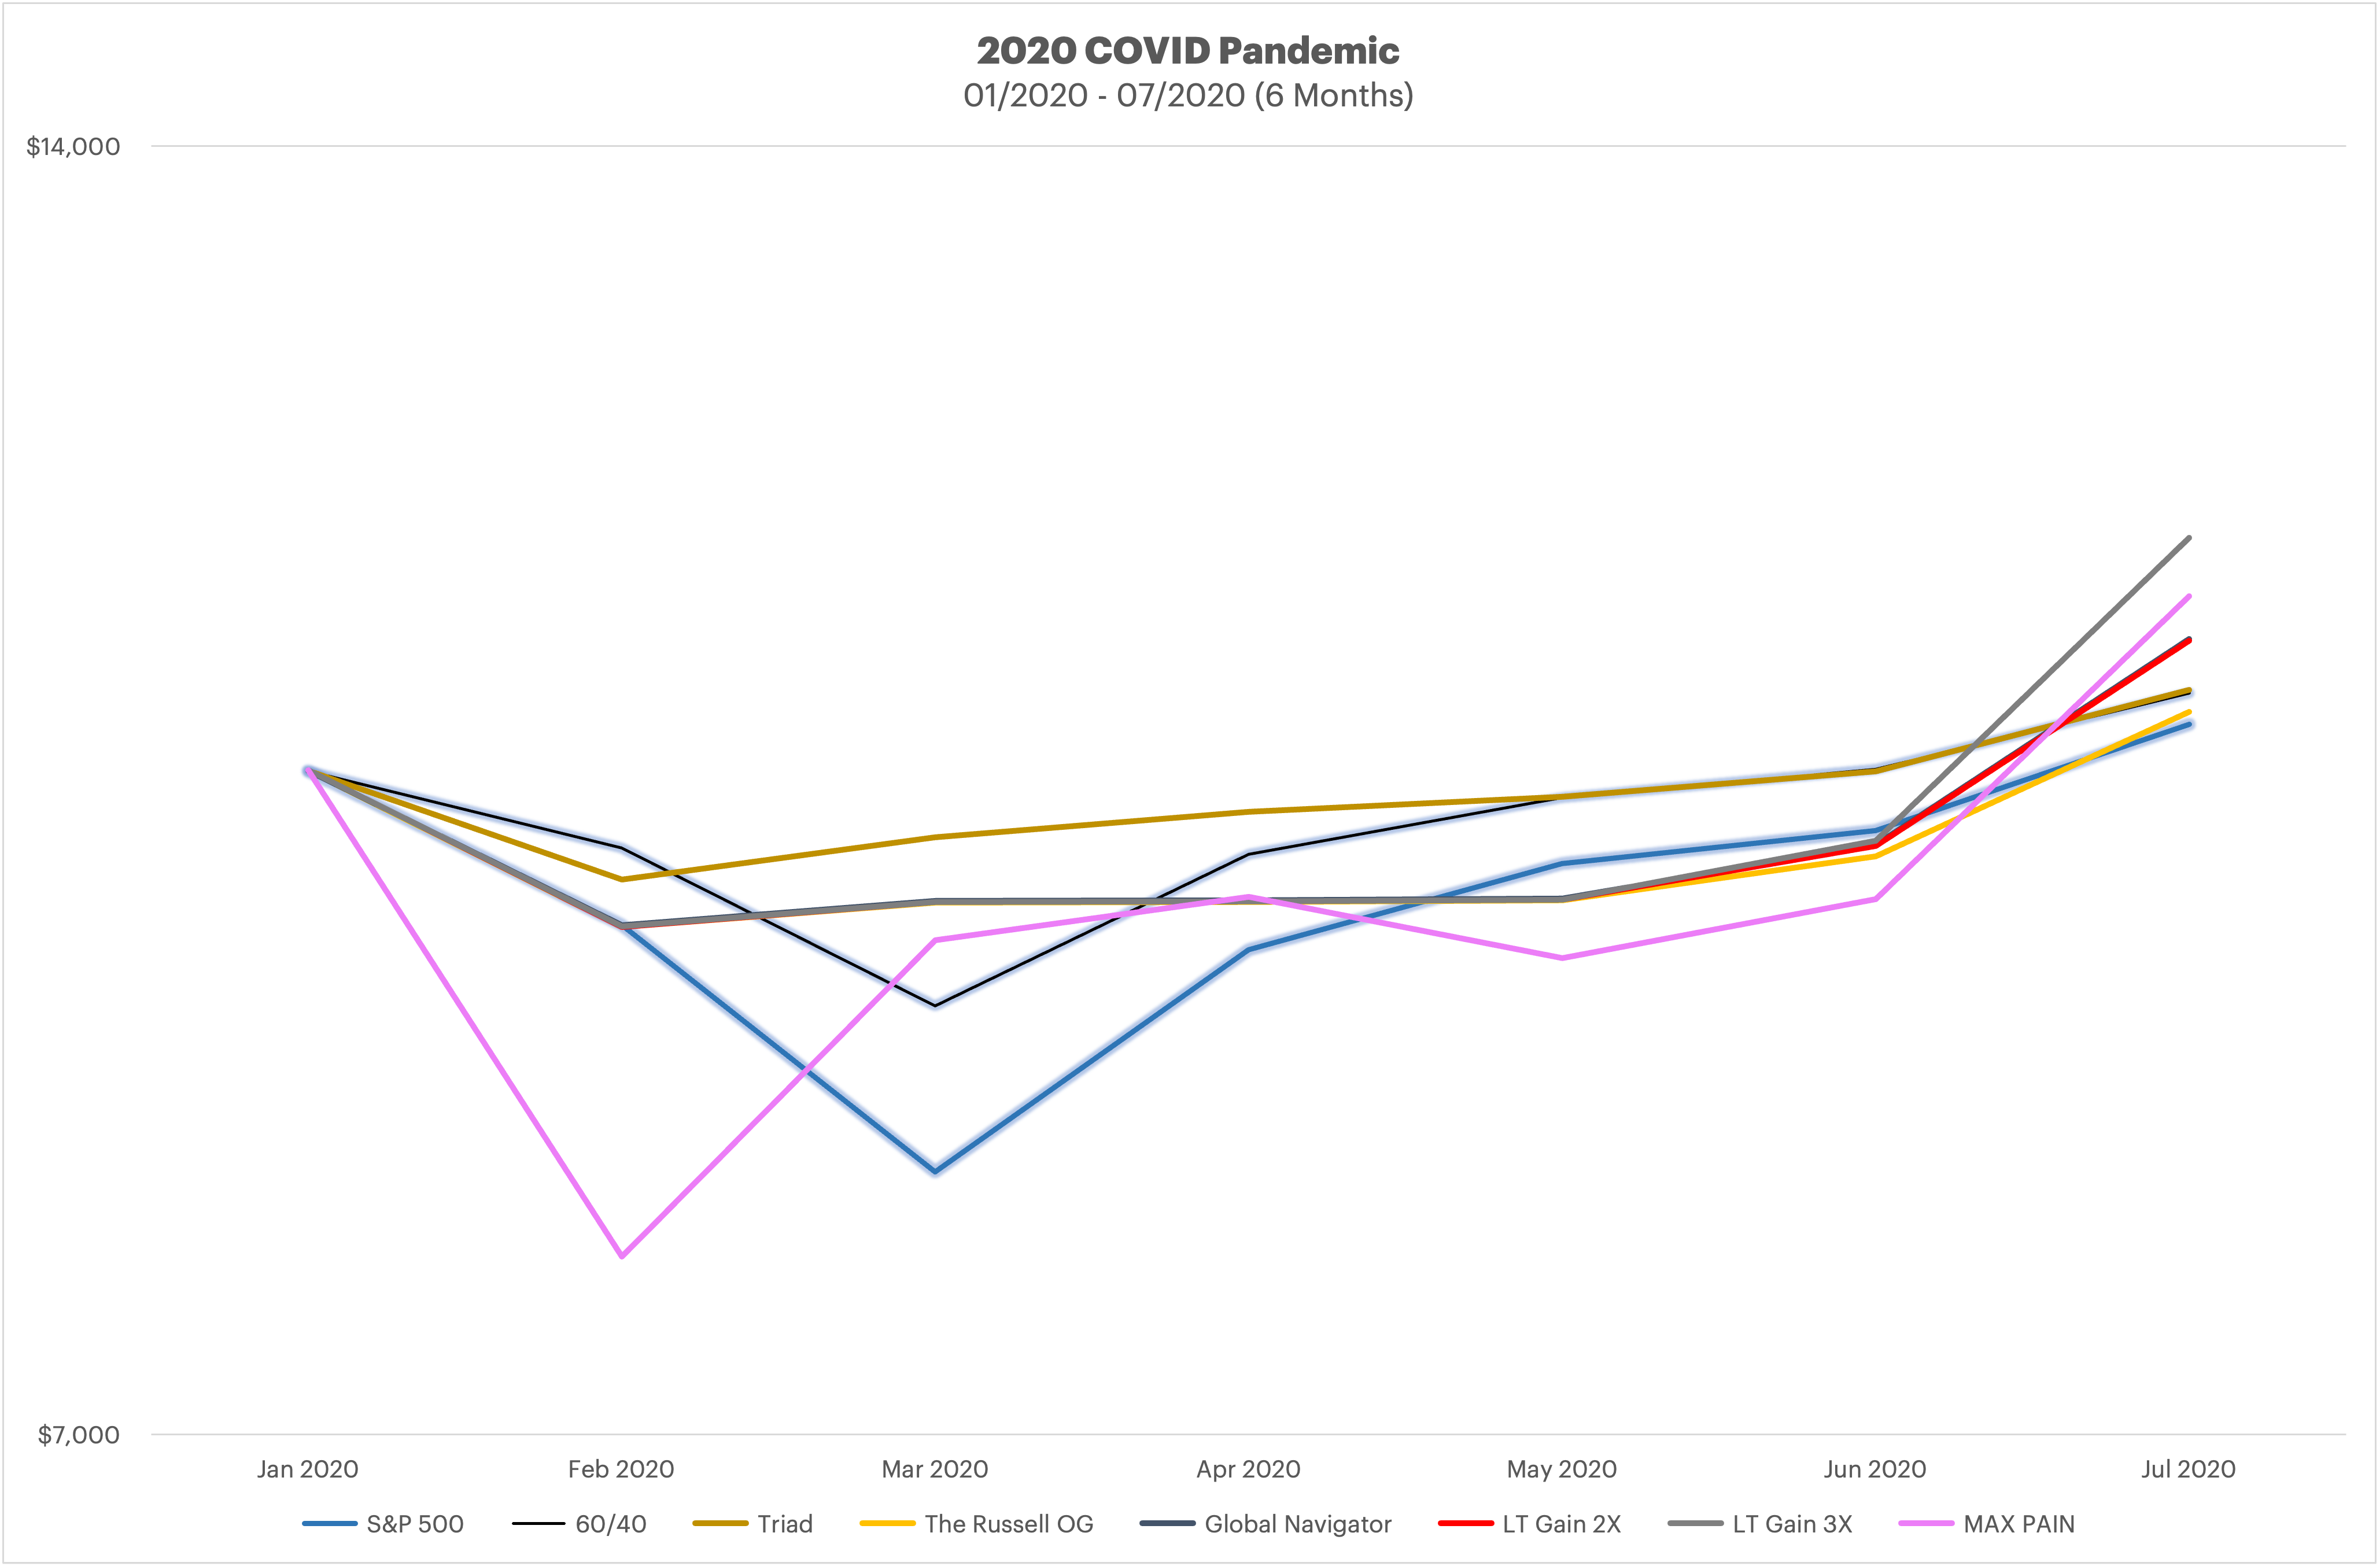
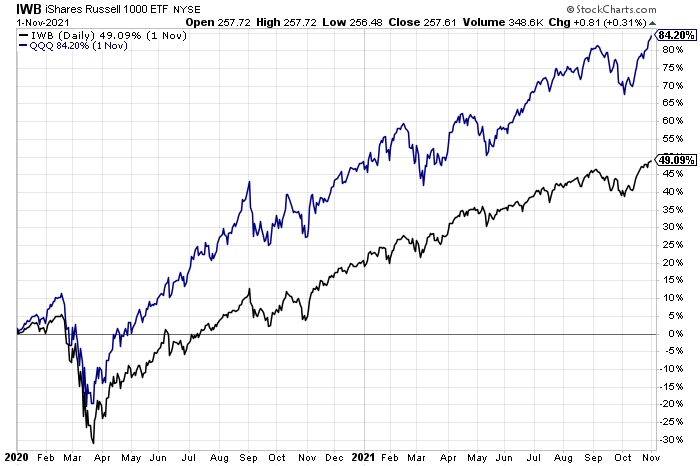
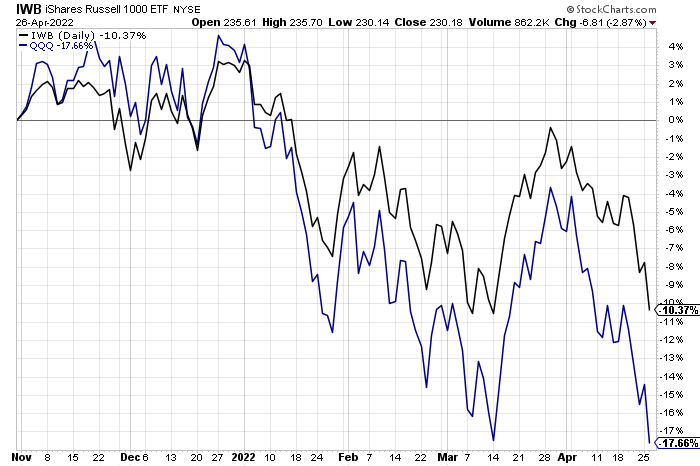
After the drop in March 2020 the markets went pretty smoothly up through late 2021, it was a long run which made for large gains. An investor with a more risk averse portfolio would have been more modestly invested than the market, and possibly feeling a bit of FOMO during that boom time. However, we have had a bit of a drawdown since late 2021 and now that more moderate portfolio is looking pretty good and there is currently no FOMO when you are not going down nearly as much as the markets.
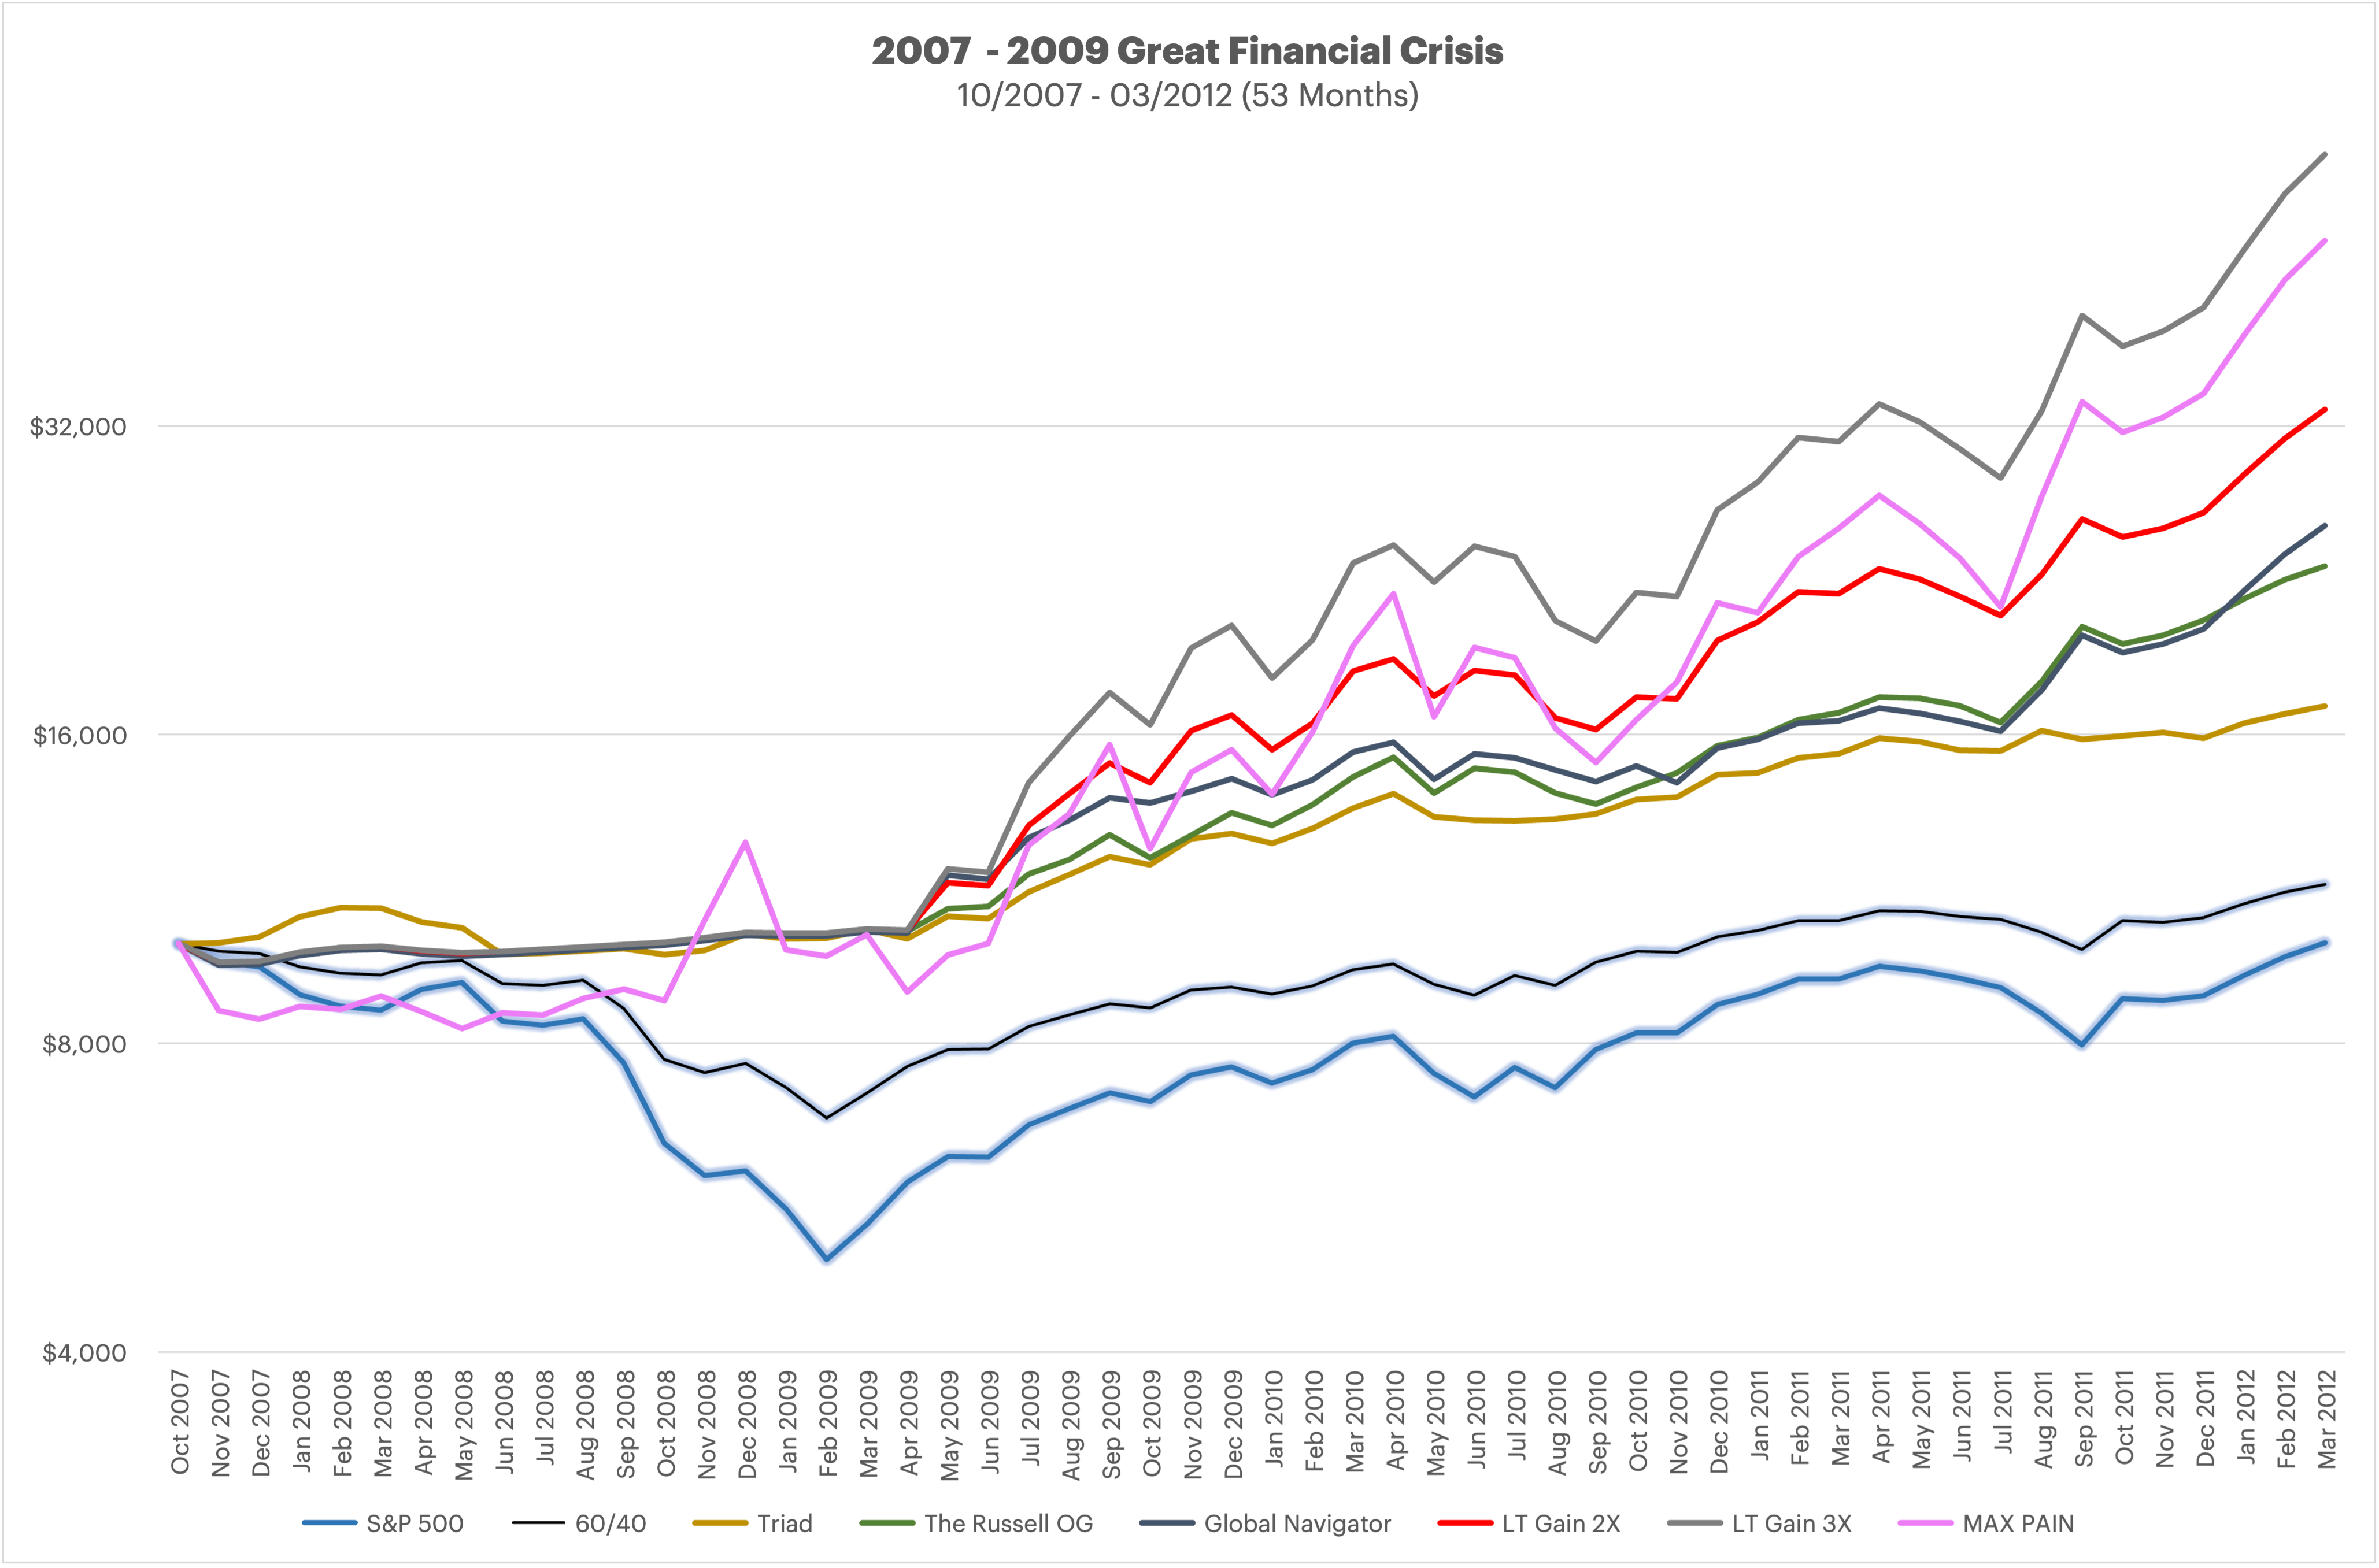
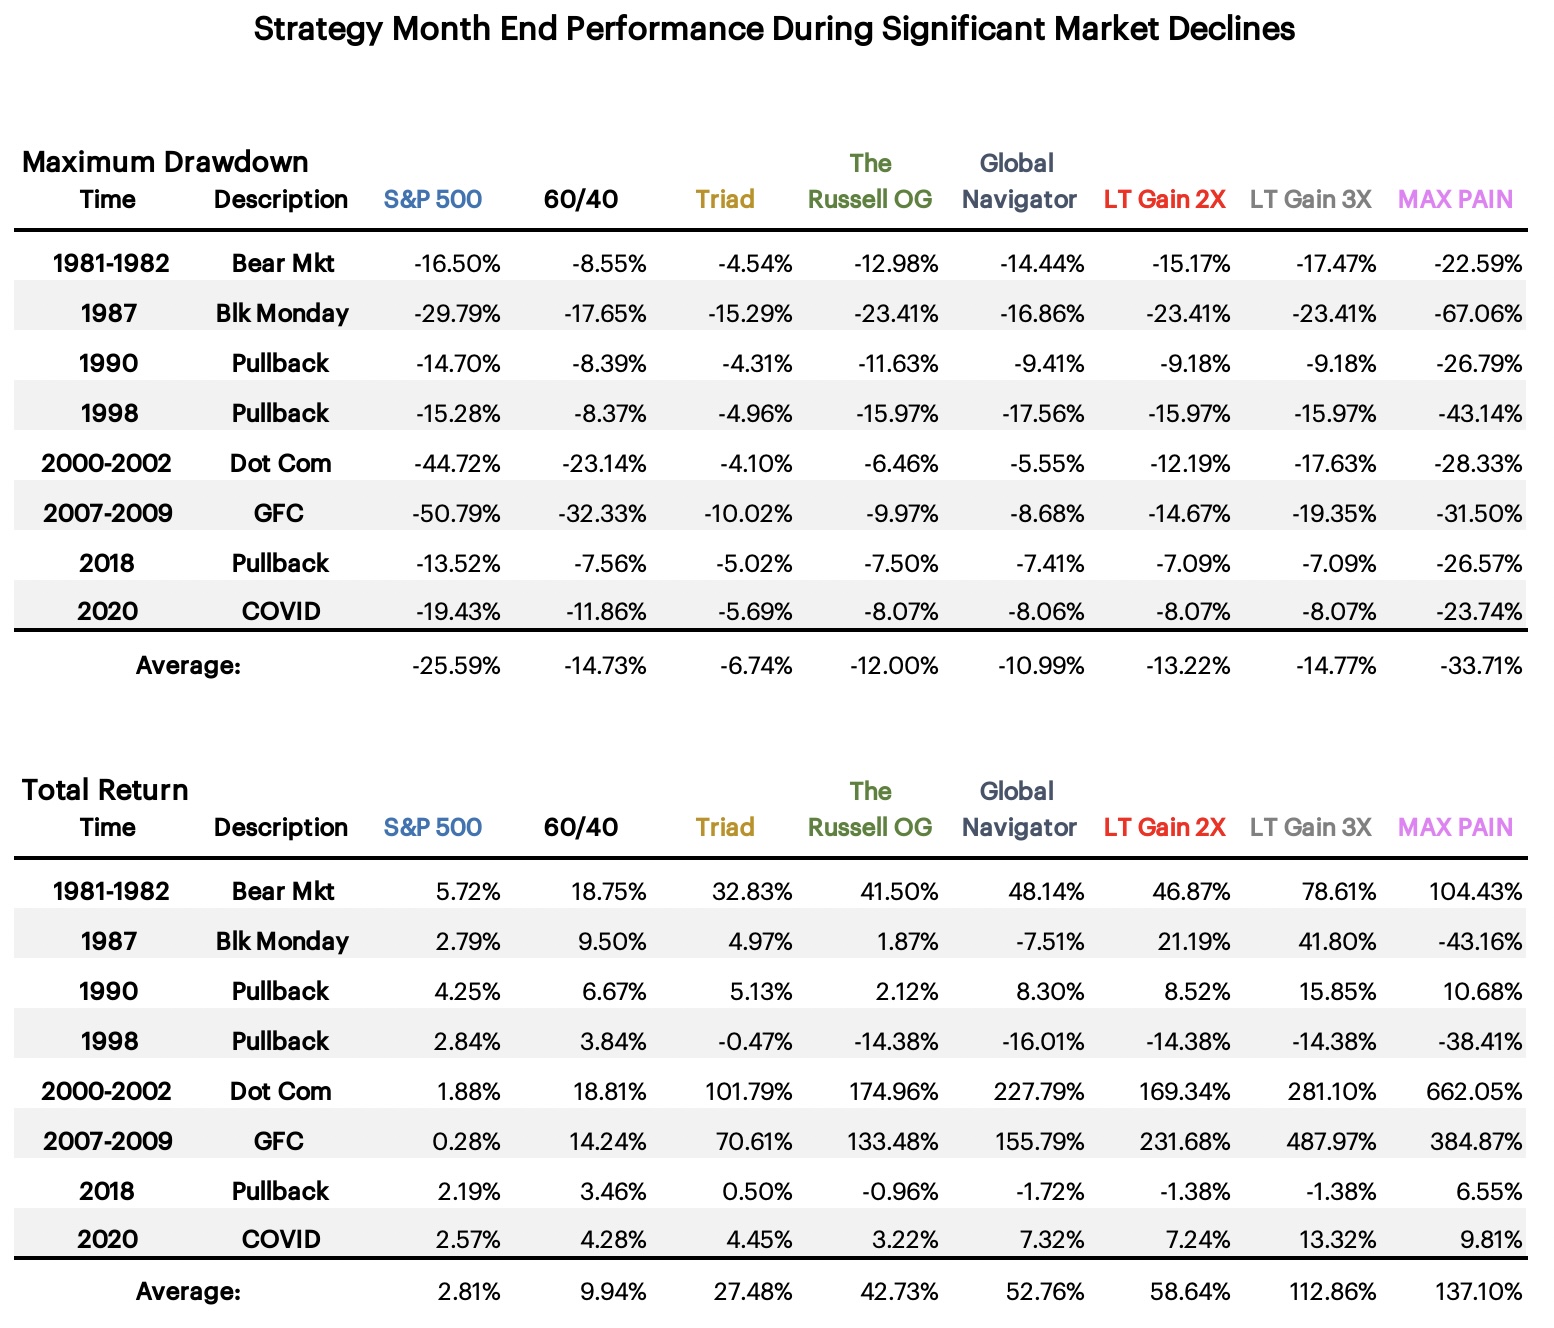
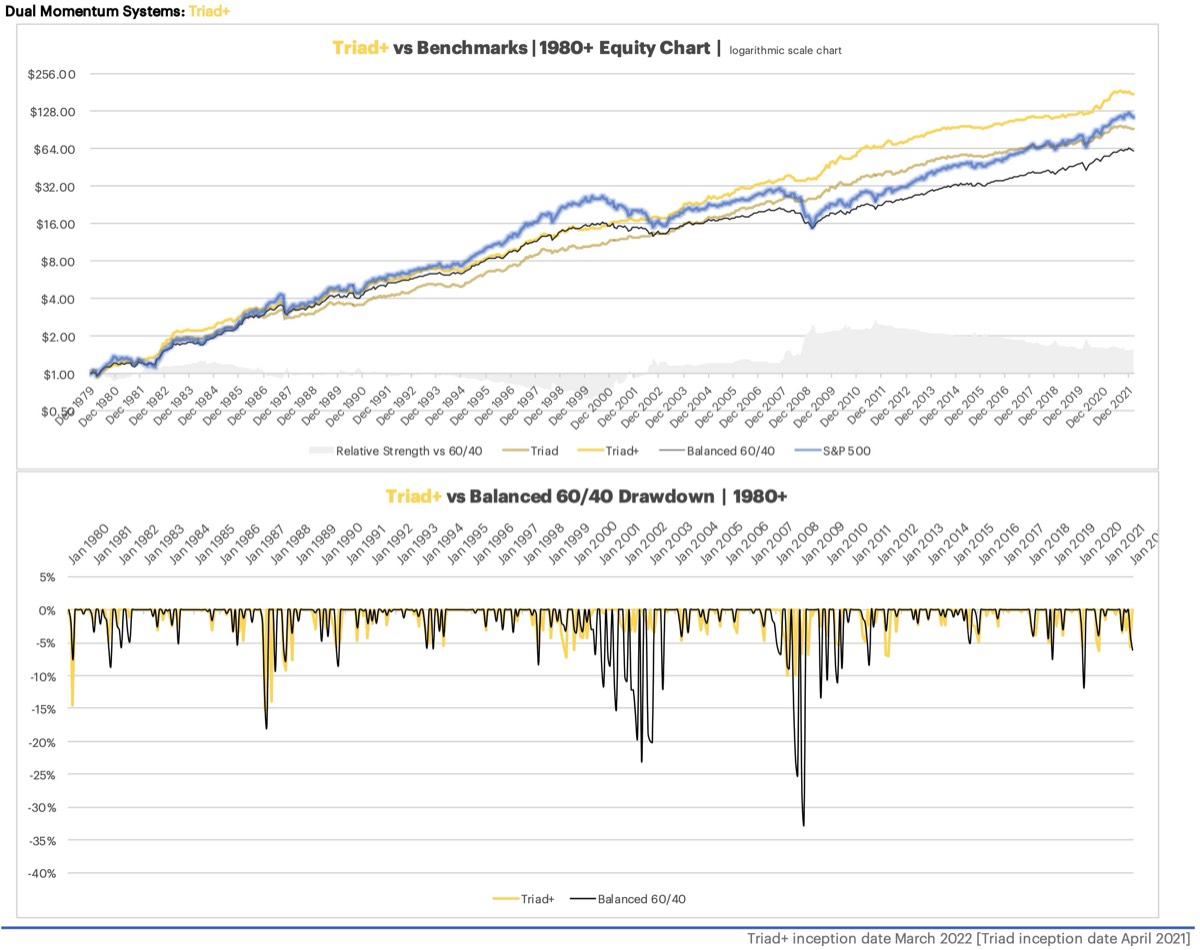
When putting your portfolio together, it is a good idea to take the full market cycle and the possible swings that you may incur into account, consider both the good and the bad times. For example, it would be easy to look at the LT gain 3X strategy and it’s excellent risk adjusted metrics, say to yourself - that’s for me! 100% allocation to it (I had somebody tell me this in email just the other day.) And while the use of Smart Leverage improves the chances of not suffering a massive drawdown - it is still entirely possible. Think back to 2008, we had a period of time that did well in the middle of the drawdown. The DMS strategies happened to not go back into equities until around May 2009 but let’s play devils advocate and say that maybe the market had enough of a rise in the middle of the huge down trend that it triggered a buy signal and if you went in at that time with 100% at 3X leverage and let’s say for arguments sake that the market dumped 20% the next month, you would now be looking at a 60% drawdown in your portfolio in just one month. This is an entirely feasible possibility even though in all the many years of backtesting it never has. Let’s face it, as we are this year seeing the largest drawdowns in bonds that have ever happened, shit does happen.
I find backtesting strategies to be a really good idea to see how events of the past effect the strategy, going back in time to kick the tires. But a backtest doesn't mean that the worst is behind us. To paraphrase Meb Faber, "your largest drawdown is always ahead of you." And while on the topic of backtesting to kick the tires, I have stated it before but be want to reiterate that I do not tweak the strategies so that it they handle past events better. I have no interest in trying to make them look better over the backtest, I put my money into these strategies and am not trying to fool anybody, myself included. Enhancements to the strategies evolve over time, adding Smart Leverage and Treasury Duration Limiter, "Necessity is the mother of all innovation" comes to mind. I have added these items with the goal of improving future performance and reducing volatility. What I do not do is tweak things to avoid a certain drop in the past, or take advantage of something - that is not what these strategies are about.
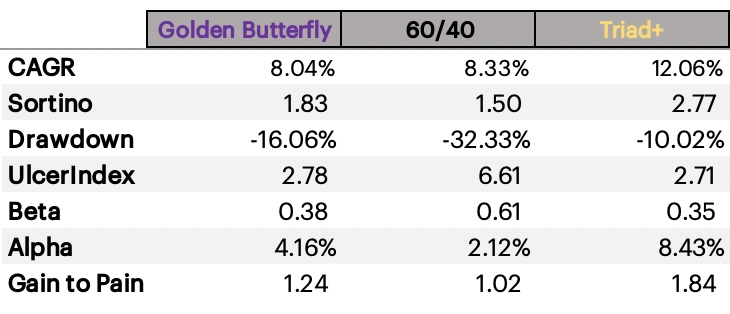
I appreciate low drawdowns and high risk adjusted metrics. This is why all of the Model Portfolios now shown in the Reporting Decks (even the current Model Aggressive Portfolio) has an allocation to Triad+, it is a low volatility strategy with superior risk adjusted metrics. There is a larger allocation to Triad+ in the more conservative Model Portfolio's, but still a 30% allocation to it in the Model Aggressive Portfolio. For all the Model Portfolios I show the average leverage and the maximum leverage. The Model Aggressive Portfolio currently shows an average leverage of 114% (from 1980 forward) and a maximum leverage of 220%. These two numbers tell you that on AVERAGE the strategy is not usually leveraged, but when it is, it has a 220% allocation which is significant. Don't allocate to this thinking the leverage is 114%, that is the average, normally there will be no leverage at all, but at times it will be nearly 220%.
The Model Portfolios are not intended to be a one size fits all, but an example of how the strategies can be combined for an improved overall allocation. One person my look at the Retirement portfolio and say it is far too aggressive for them. Maybe they want 70% Triad and 30% cash. Another person maybe with large retirement balances may be see the Model Aggressive Portfolio as not nearly aggressive enough since they have a large buffer. If you want to see the stats for a specific combination of strategies shoot me a note and I'll run it if I have a minute.
Risk tolerances are very personal, only you know what is too much risk for you. I have a rather modest risk tolerance, which is in part how I ended up looking to systematic strategies and developing the DMS strategies - I don’t like the volatility and large drawdowns that come along once in a while when holding the market. Even holding a dozen or more individual securities can have far more volatility than say IWB. I don’t think that individual investors (or professionals) can sustainably pick companies that outperform the market. This is why most professionals and virtually all retail investors are substantially outperformed in terms of raw gains by the market over time. I am also very results oriented, so if the strategies are underperforming the market - I have to remind myself that this will happen, we will catch up in the bad times, and accelerate with smart leverage after the bad times, this isn’t a daily, monthly, quarterly or even annual game - we will win it over the longer run.
With the bond bull market over (or nearly over), the S&P being too much for most people to buy and hold, and the 60/40 looking very out of favor in the current bond environment - a systematic investing approach, like the strategies offered here at DMS seems more rational than ever.
Please reach out with any questions, share with your family and friends, allocate appropriately.
I find backtesting strategies to be a really good idea to see how events of the past effect the strategy, going back in time to kick the tires. But a backtest doesn't mean that the worst is behind us. To paraphrase Meb Faber, "your largest drawdown is always ahead of you." And while on the topic of backtesting to kick the tires, I have stated it before but be want to reiterate that I do not tweak the strategies so that it they handle past events better. I have no interest in trying to make them look better over the backtest, I put my money into these strategies and am not trying to fool anybody, myself included. Enhancements to the strategies evolve over time, adding Smart Leverage and Treasury Duration Limiter, "Necessity is the mother of all innovation" comes to mind. I have added these items with the goal of improving future performance and reducing volatility. What I do not do is tweak things to avoid a certain drop in the past, or take advantage of something - that is not what these strategies are about.
I appreciate low drawdowns and high risk adjusted metrics. This is why all of the Model Portfolios now shown in the Reporting Decks (even the current Model Aggressive Portfolio) has an allocation to Triad+, it is a low volatility strategy with superior risk adjusted metrics. There is a larger allocation to Triad+ in the more conservative Model Portfolio's, but still a 30% allocation to it in the Model Aggressive Portfolio. For all the Model Portfolios I show the average leverage and the maximum leverage. The Model Aggressive Portfolio currently shows an average leverage of 114% (from 1980 forward) and a maximum leverage of 220%. These two numbers tell you that on AVERAGE the strategy is not usually leveraged, but when it is, it has a 220% allocation which is significant. Don't allocate to this thinking the leverage is 114%, that is the average, normally there will be no leverage at all, but at times it will be nearly 220%.
The Model Portfolios are not intended to be a one size fits all, but an example of how the strategies can be combined for an improved overall allocation. One person my look at the Retirement portfolio and say it is far too aggressive for them. Maybe they want 70% Triad and 30% cash. Another person maybe with large retirement balances may be see the Model Aggressive Portfolio as not nearly aggressive enough since they have a large buffer. If you want to see the stats for a specific combination of strategies shoot me a note and I'll run it if I have a minute.
Risk tolerances are very personal, only you know what is too much risk for you. I have a rather modest risk tolerance, which is in part how I ended up looking to systematic strategies and developing the DMS strategies - I don’t like the volatility and large drawdowns that come along once in a while when holding the market. Even holding a dozen or more individual securities can have far more volatility than say IWB. I don’t think that individual investors (or professionals) can sustainably pick companies that outperform the market. This is why most professionals and virtually all retail investors are substantially outperformed in terms of raw gains by the market over time. I am also very results oriented, so if the strategies are underperforming the market - I have to remind myself that this will happen, we will catch up in the bad times, and accelerate with smart leverage after the bad times, this isn’t a daily, monthly, quarterly or even annual game - we will win it over the longer run.
With the bond bull market over (or nearly over), the S&P being too much for most people to buy and hold, and the 60/40 looking very out of favor in the current bond environment - a systematic investing approach, like the strategies offered here at DMS seems more rational than ever.
Please reach out with any questions, share with your family and friends, allocate appropriately.